Plots
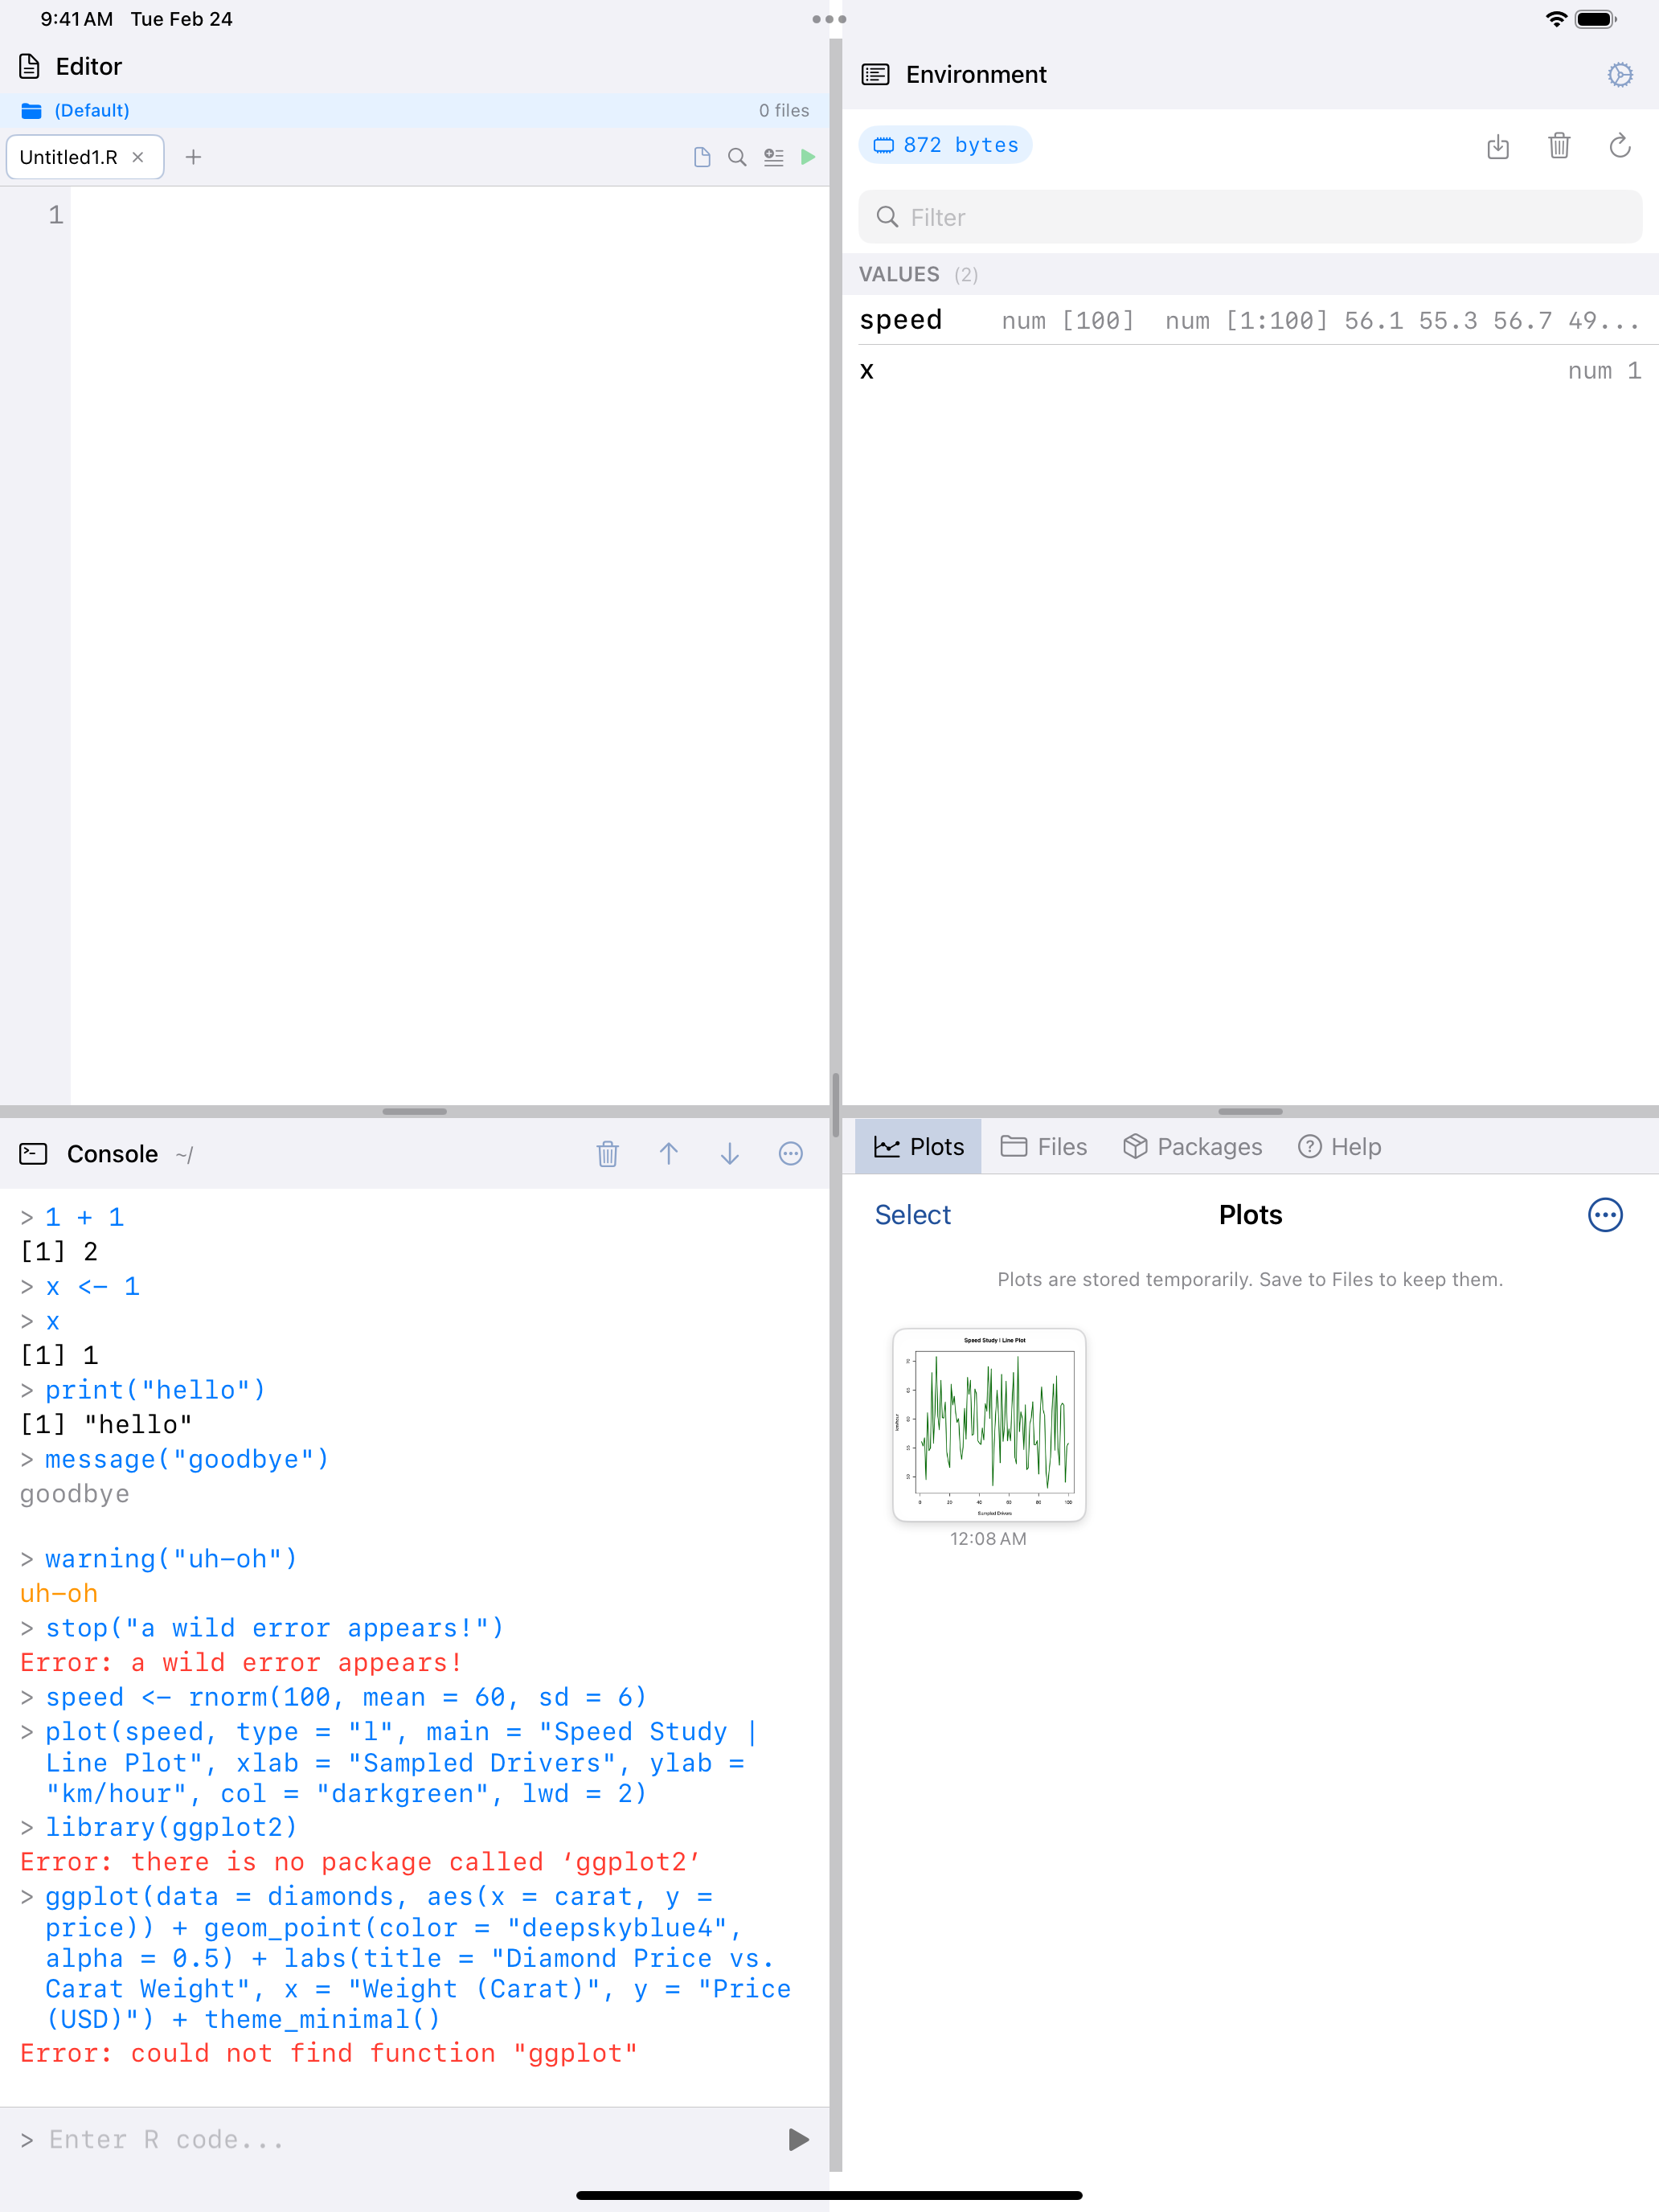
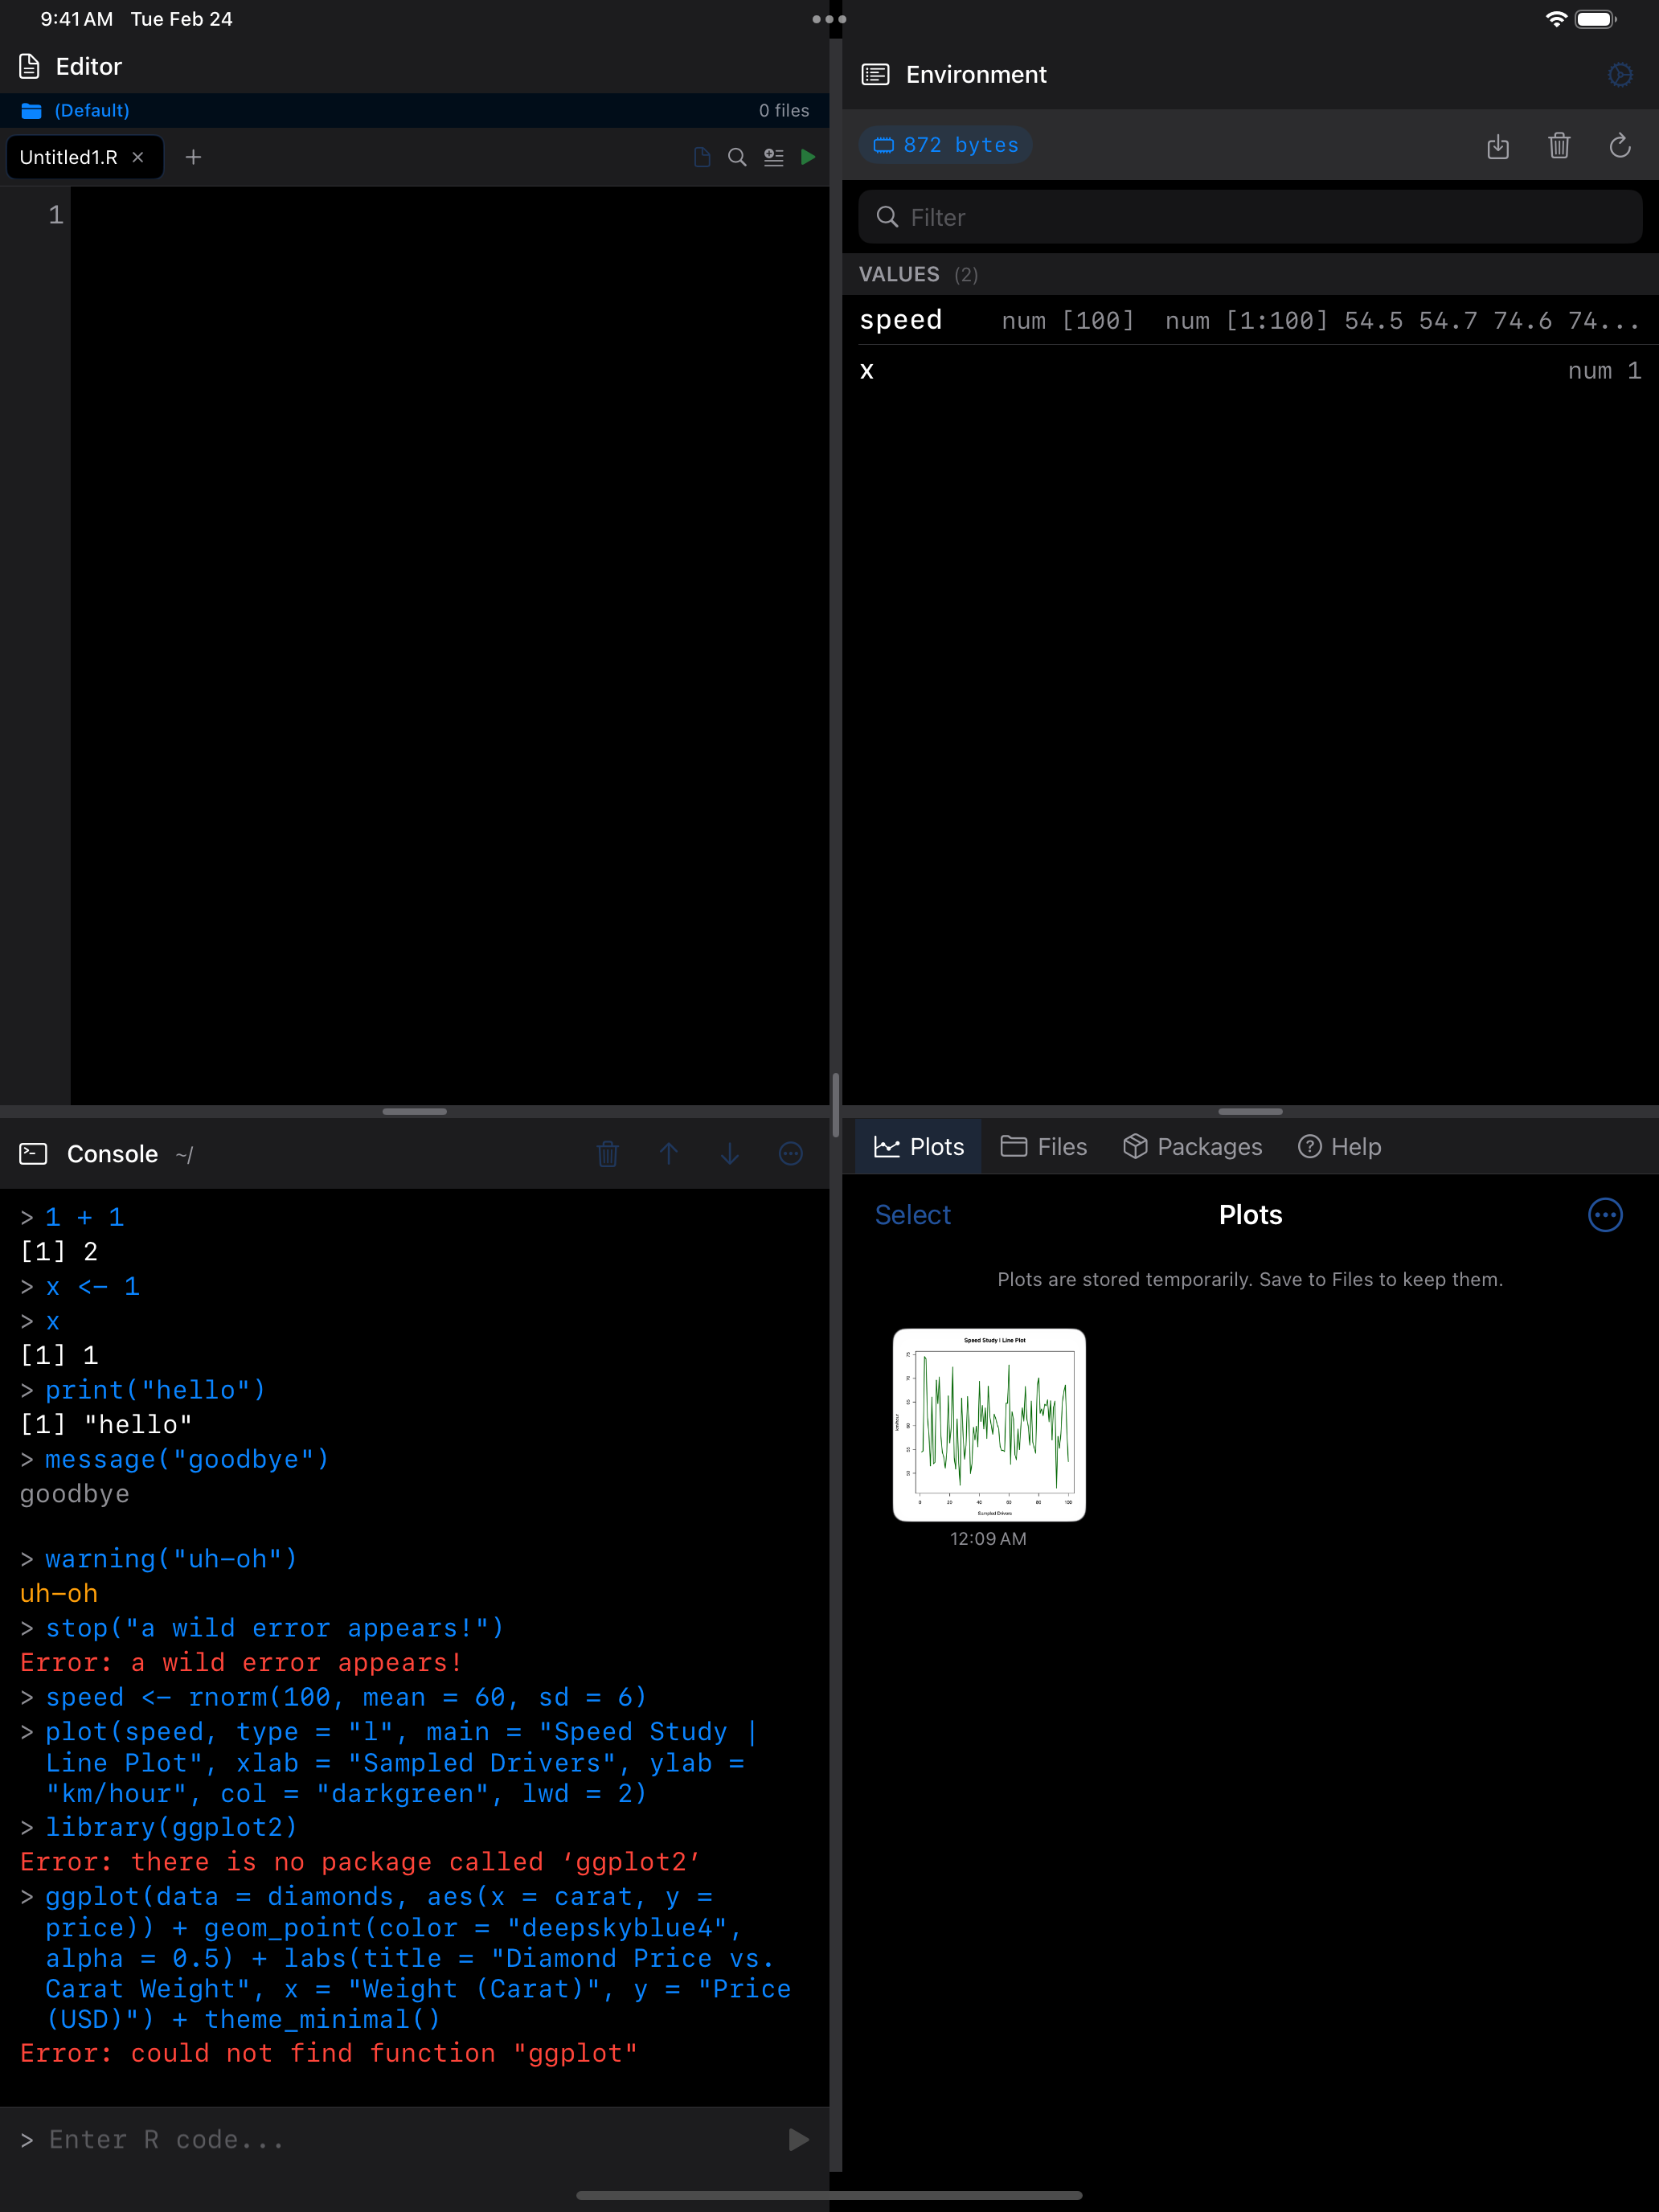
One of the best things about R is how easy it is to create visualizations, and webR on iOS makes that just as seamless. Any time your R code generates a graphic, whether from the Console or the Editor, the app automatically captures it and saves it to the Plots gallery. You do not need to do anything special; just write plotting code the way you normally would.
How Plot Capture Works
Whenever you run R code that produces a graphic, the app intercepts the output and saves it as an image. This works with all of R’s built-in plotting functions and any package that uses the standard graphics system:
# Any of these will create a plot that appears in the gallery
plot(1:10, sin(1:10), type = "l", main = "Sine Wave")
hist(rnorm(100), main = "Normal Distribution")
barplot(table(sample(letters[1:5], 50, replace = TRUE)))
boxplot(mpg ~ cyl, data = mtcars)
You do not need to call dev.off() or save anything manually. The app handles all of that behind the scenes. Just run your code and flip over to the Plots tab to see the result.
The Plot Gallery
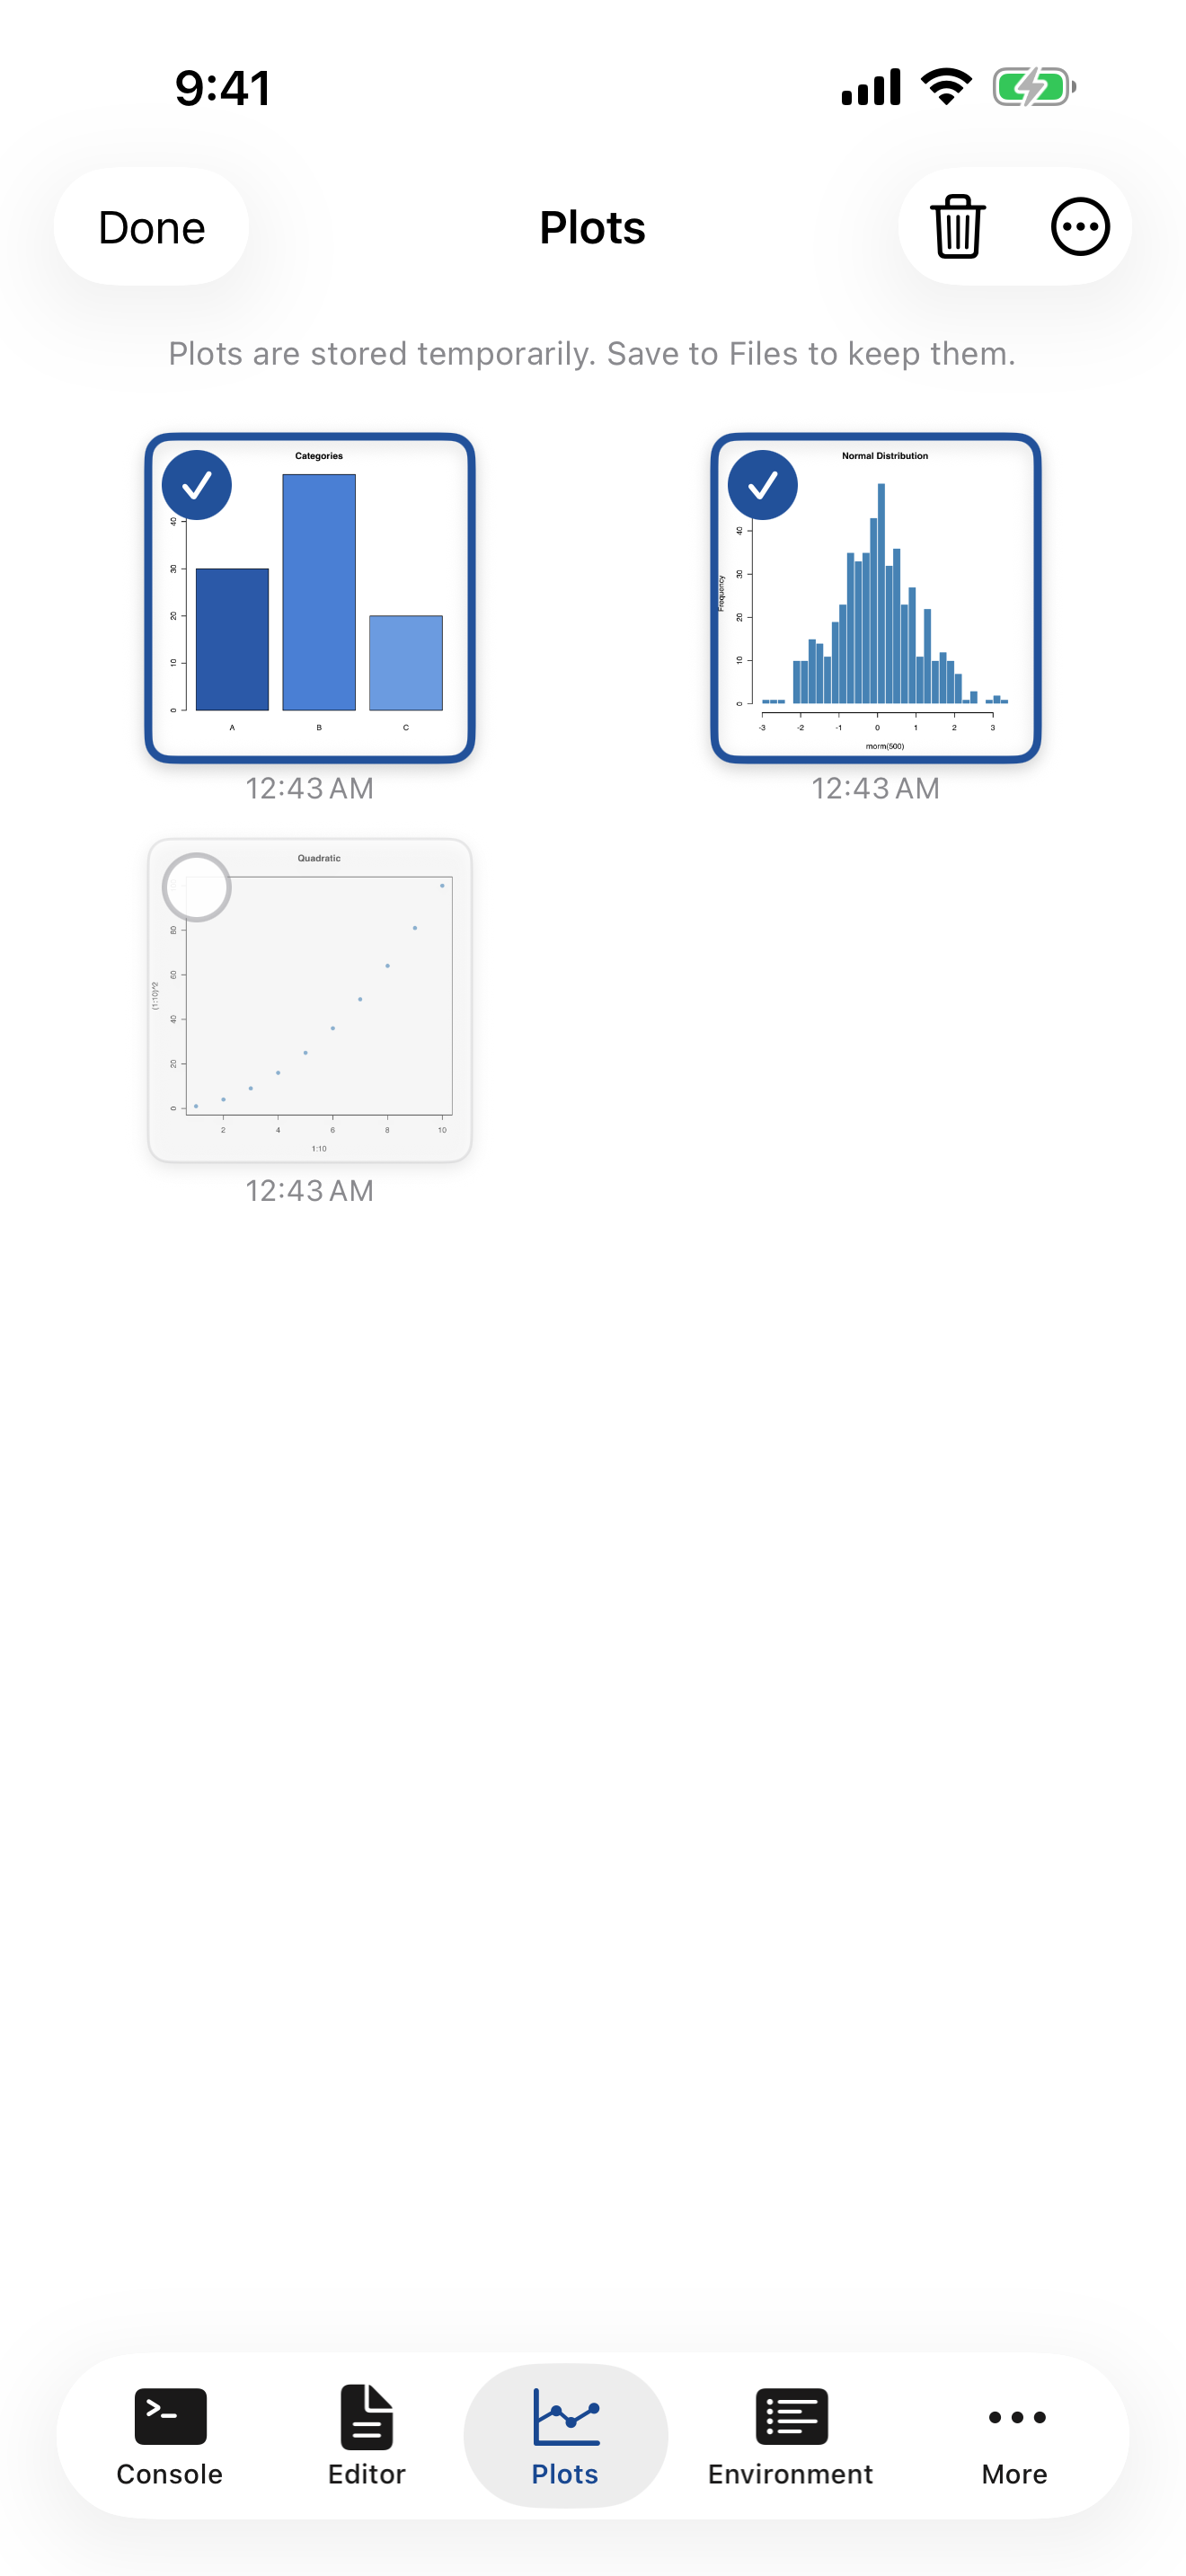
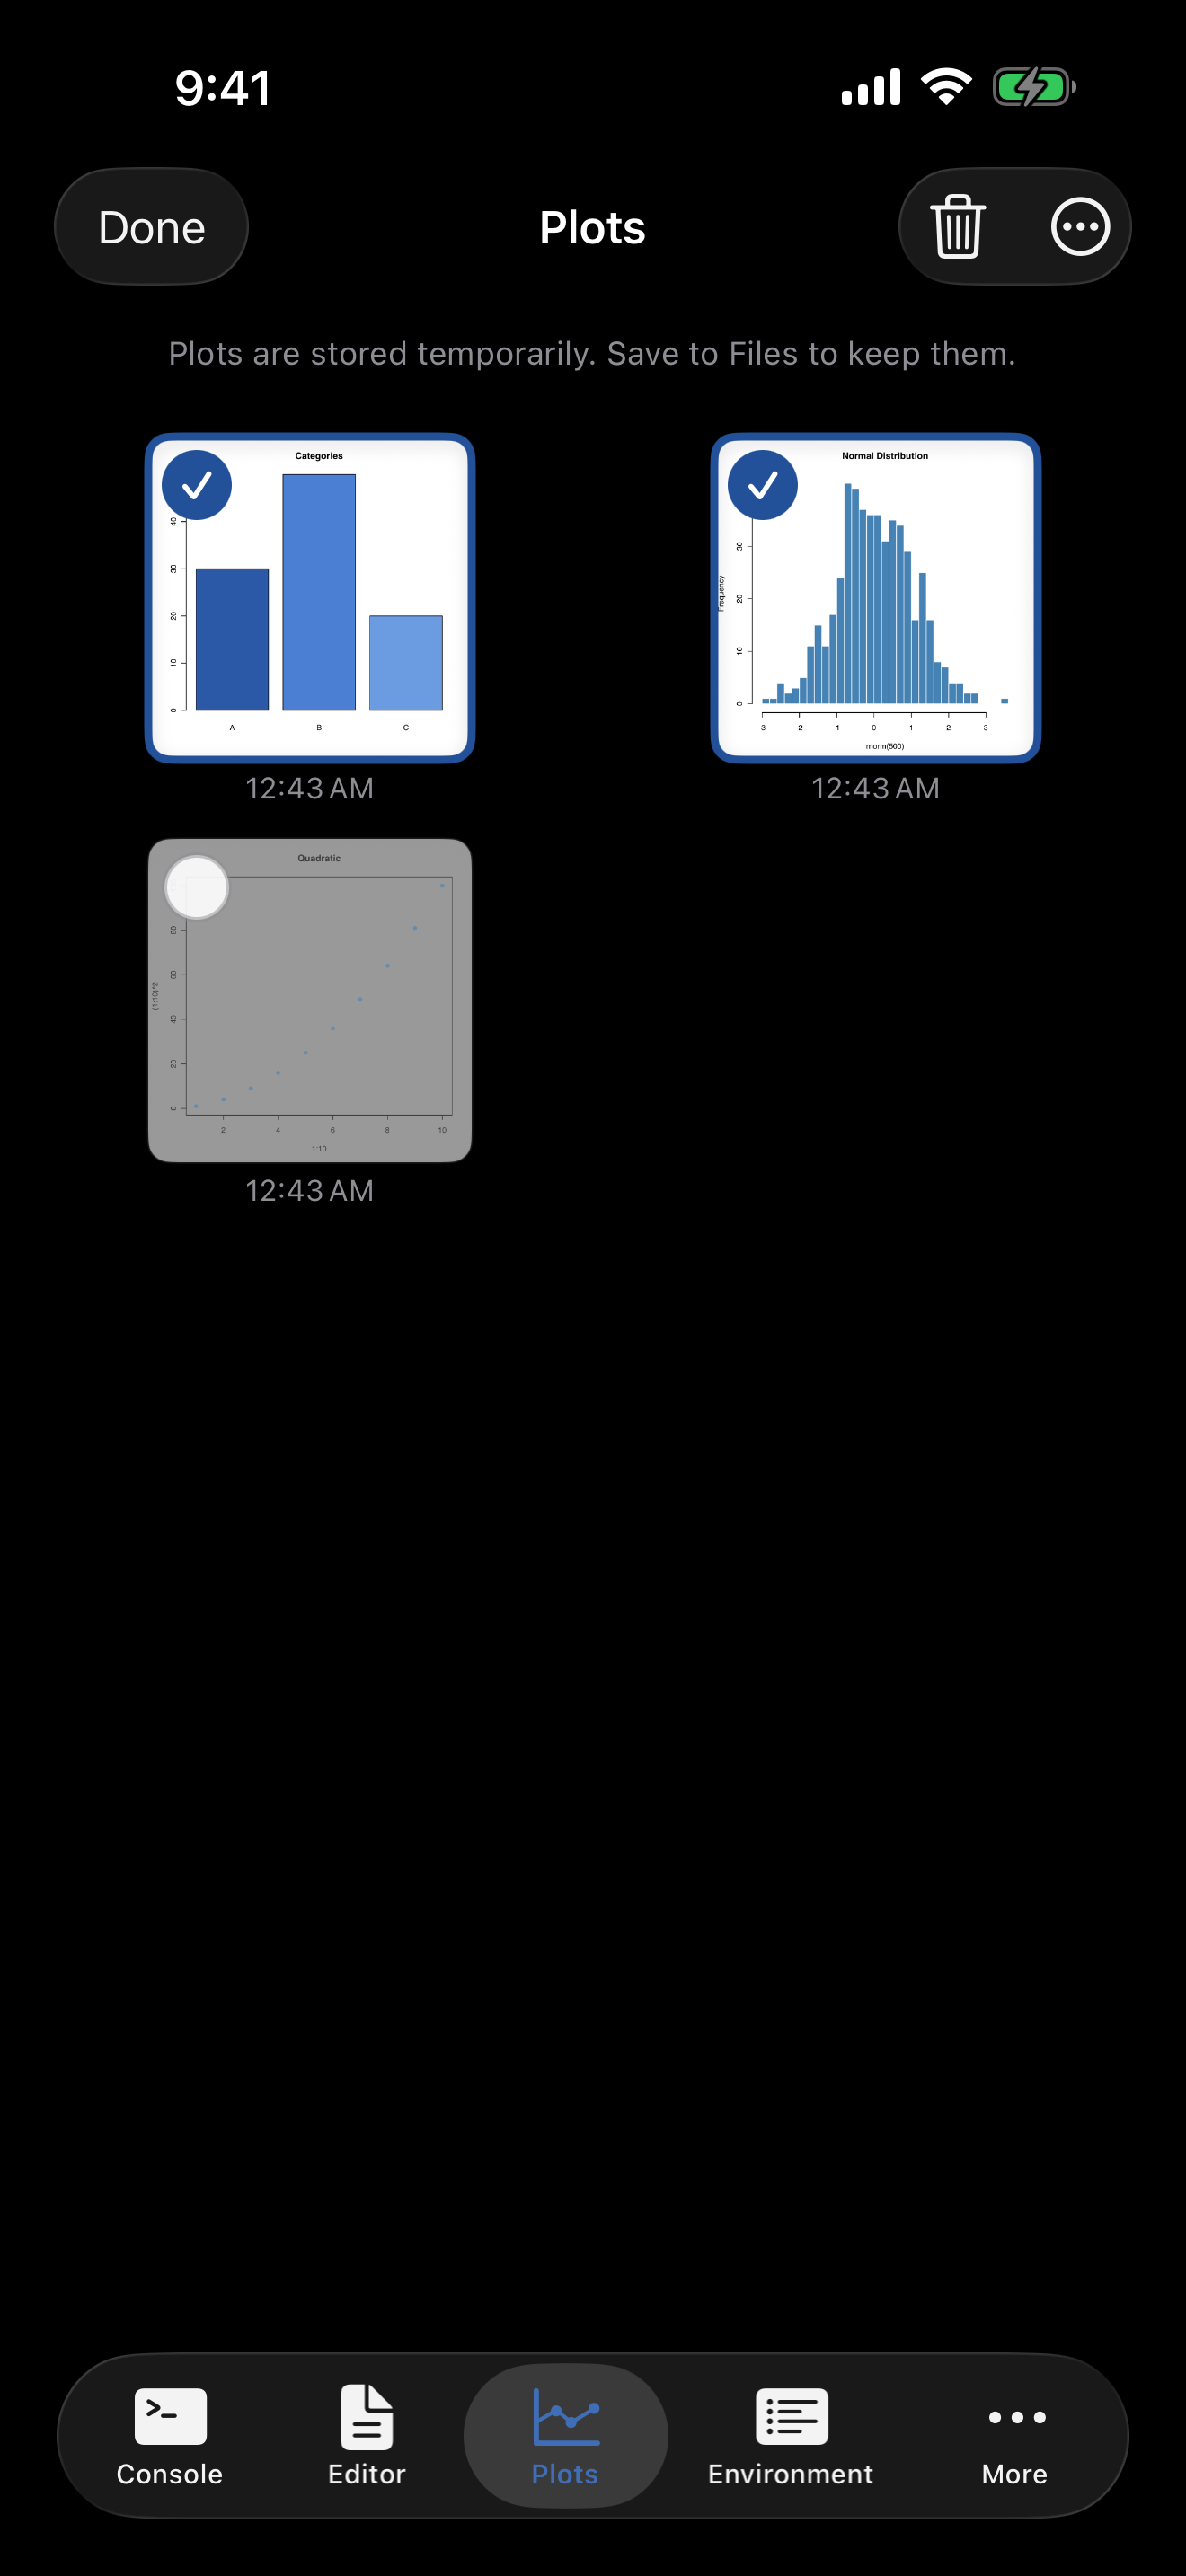
The Plots tab shows all your captured plots as a grid of thumbnails, with the most recent plots at the end. Each thumbnail includes a timestamp so you can tell when it was created.
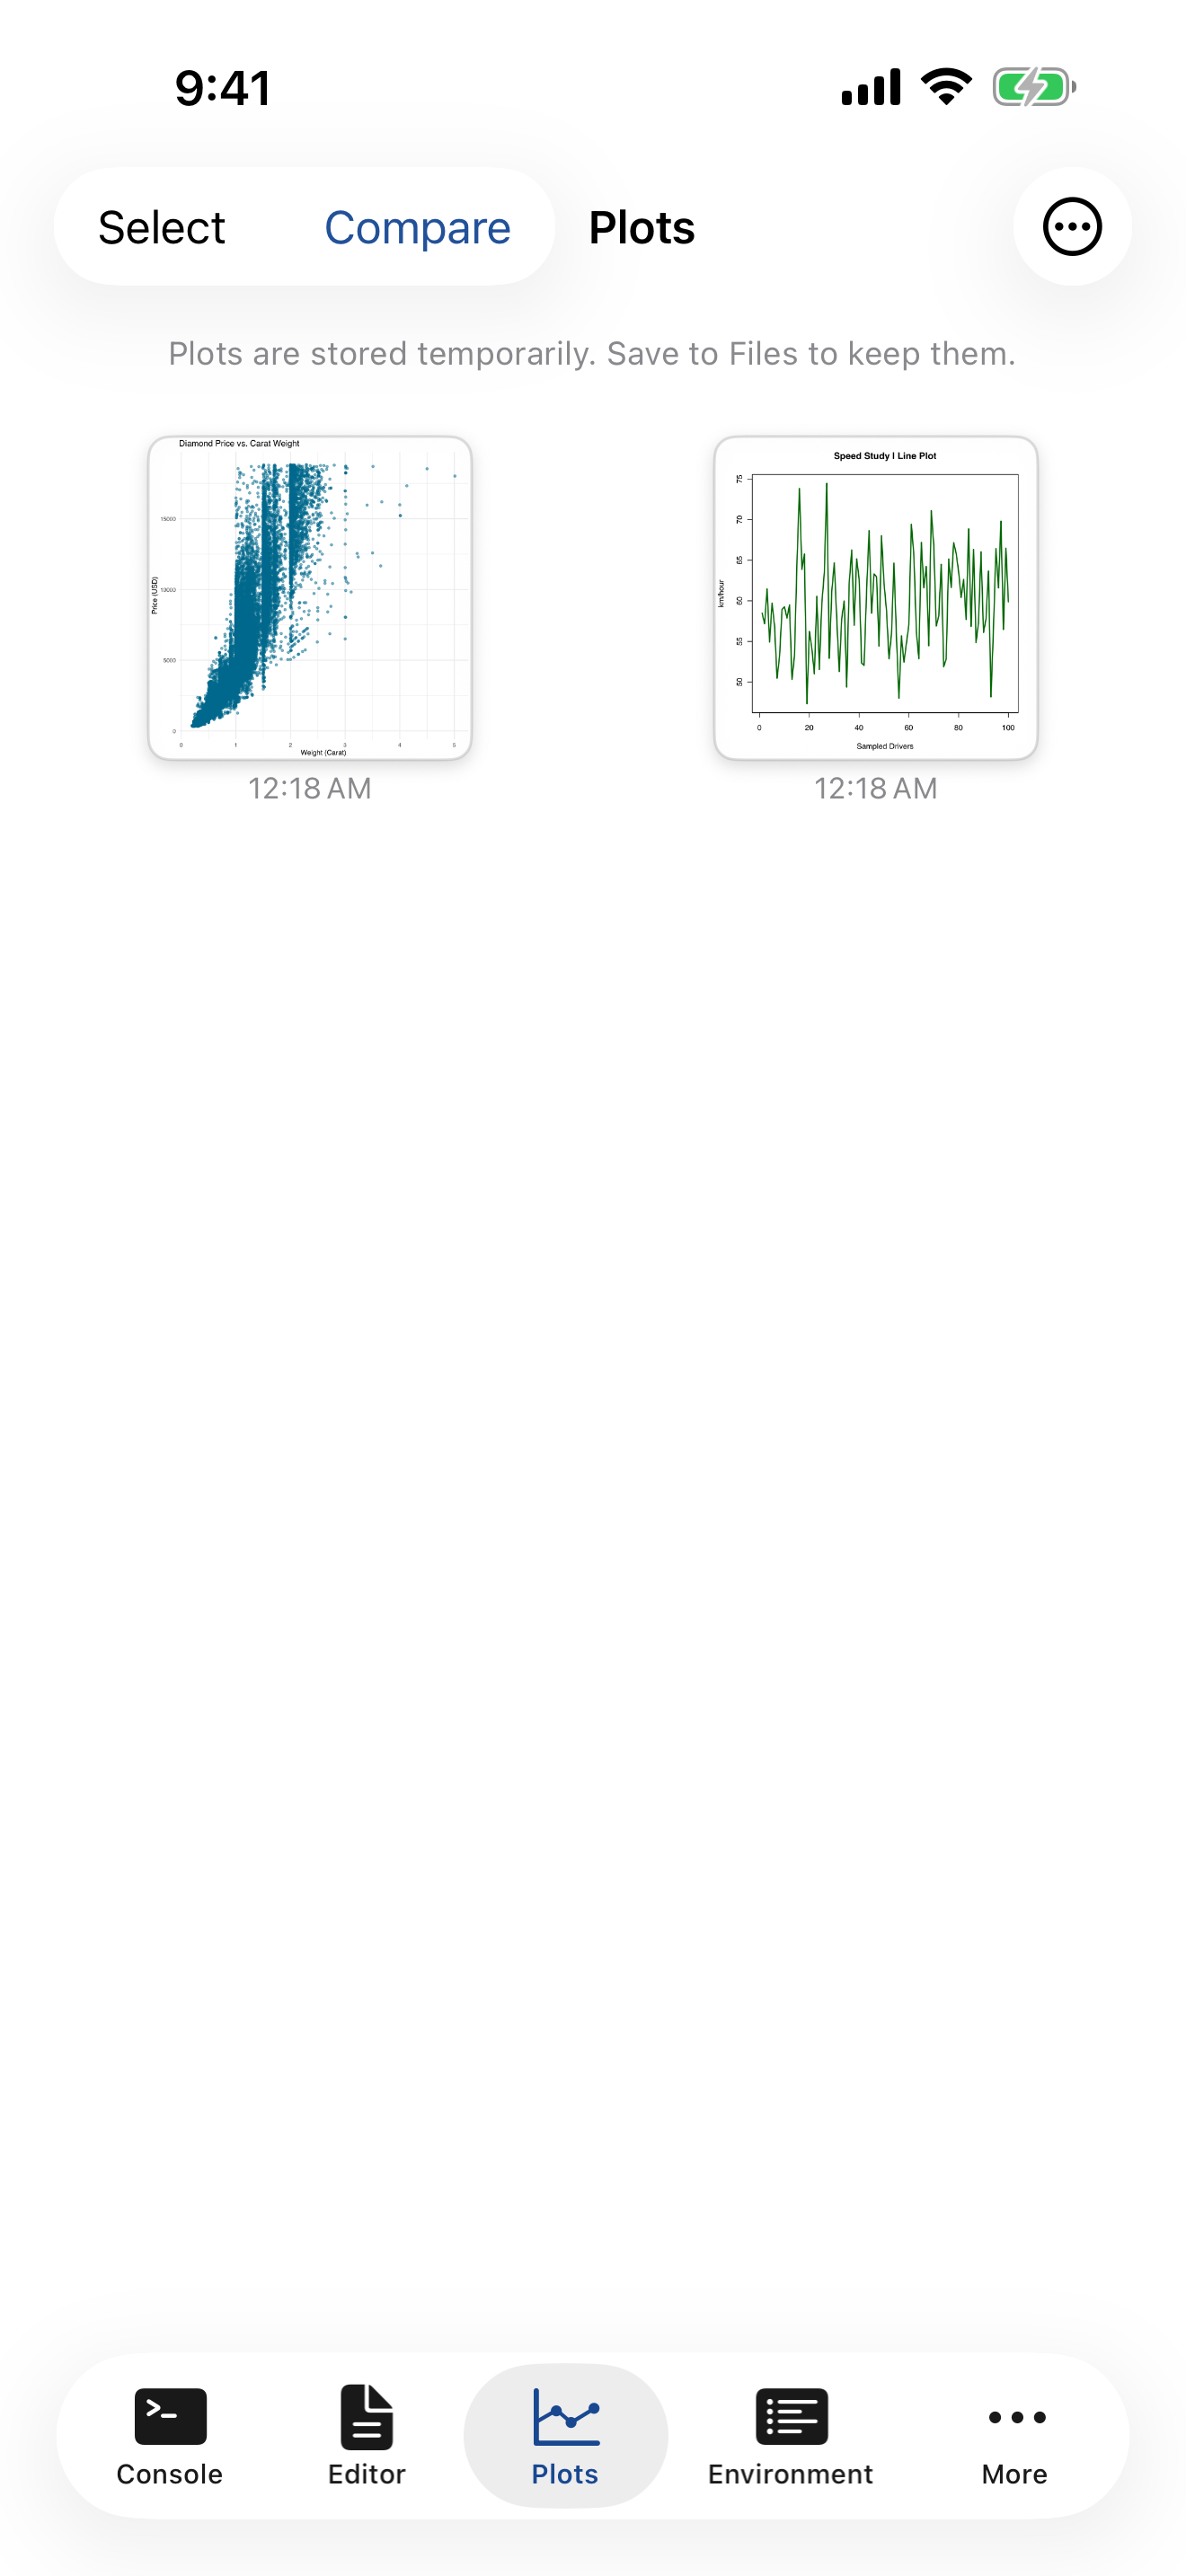

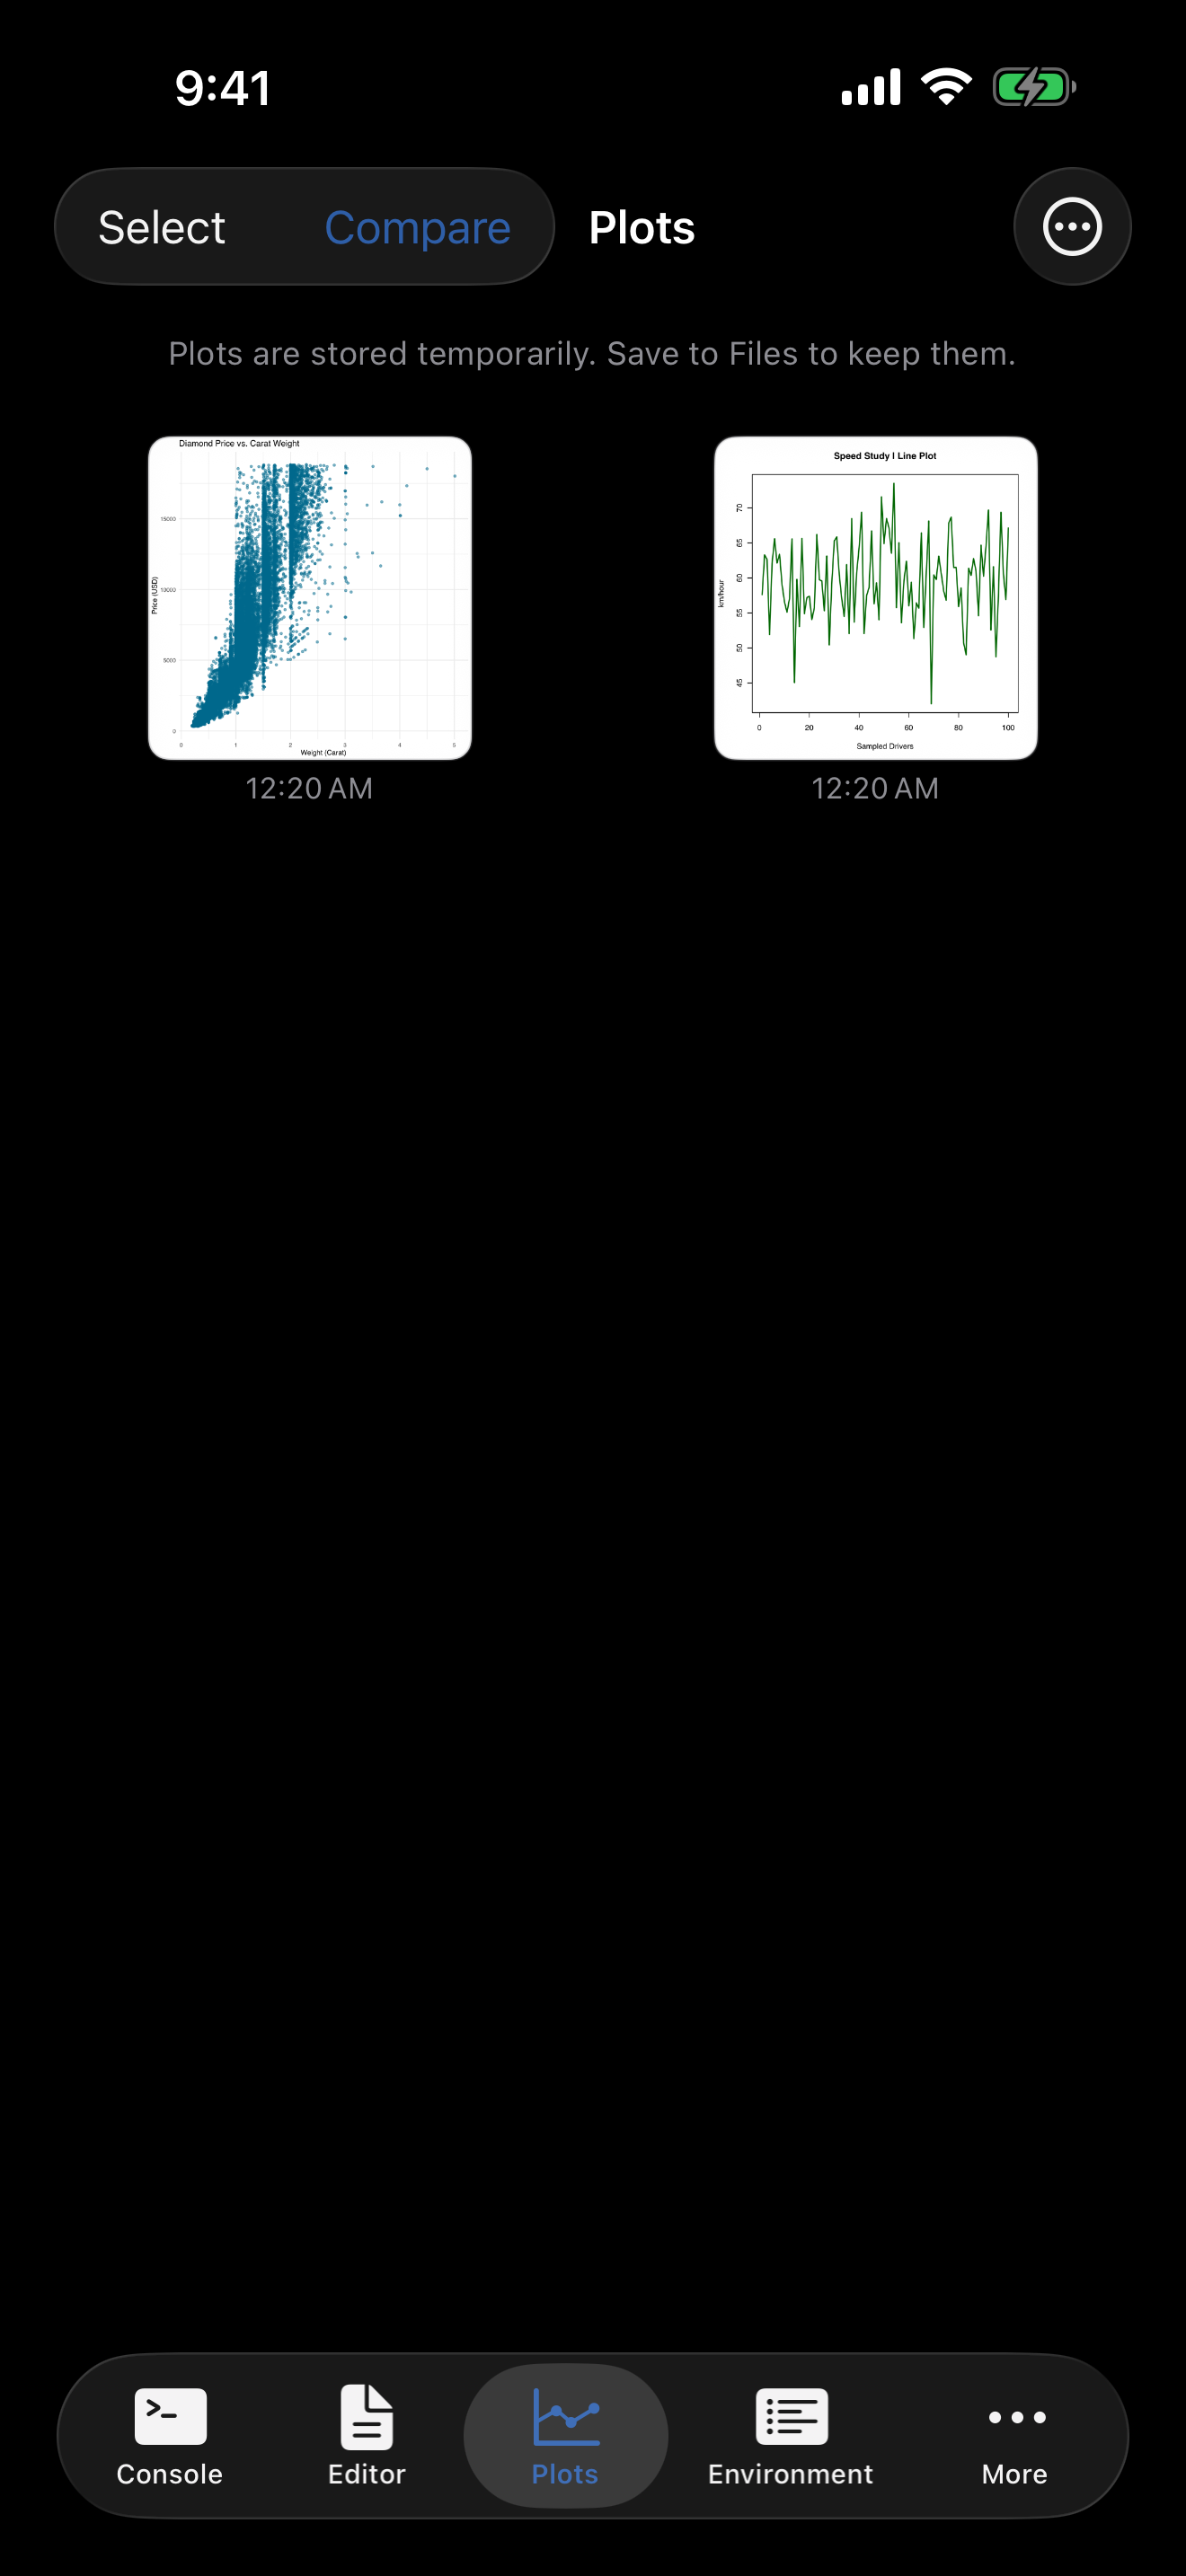

What you are seeing above:
- Thumbnail grid: each plot is shown as a tappable card with the creation time underneath
- Toolbar: provides selection mode, comparison mode, and the overflow menu for managing plots
- NEW badge: freshly created plots get a brief highlight animation so you can spot them
Tap any thumbnail to open the full-size detail view.
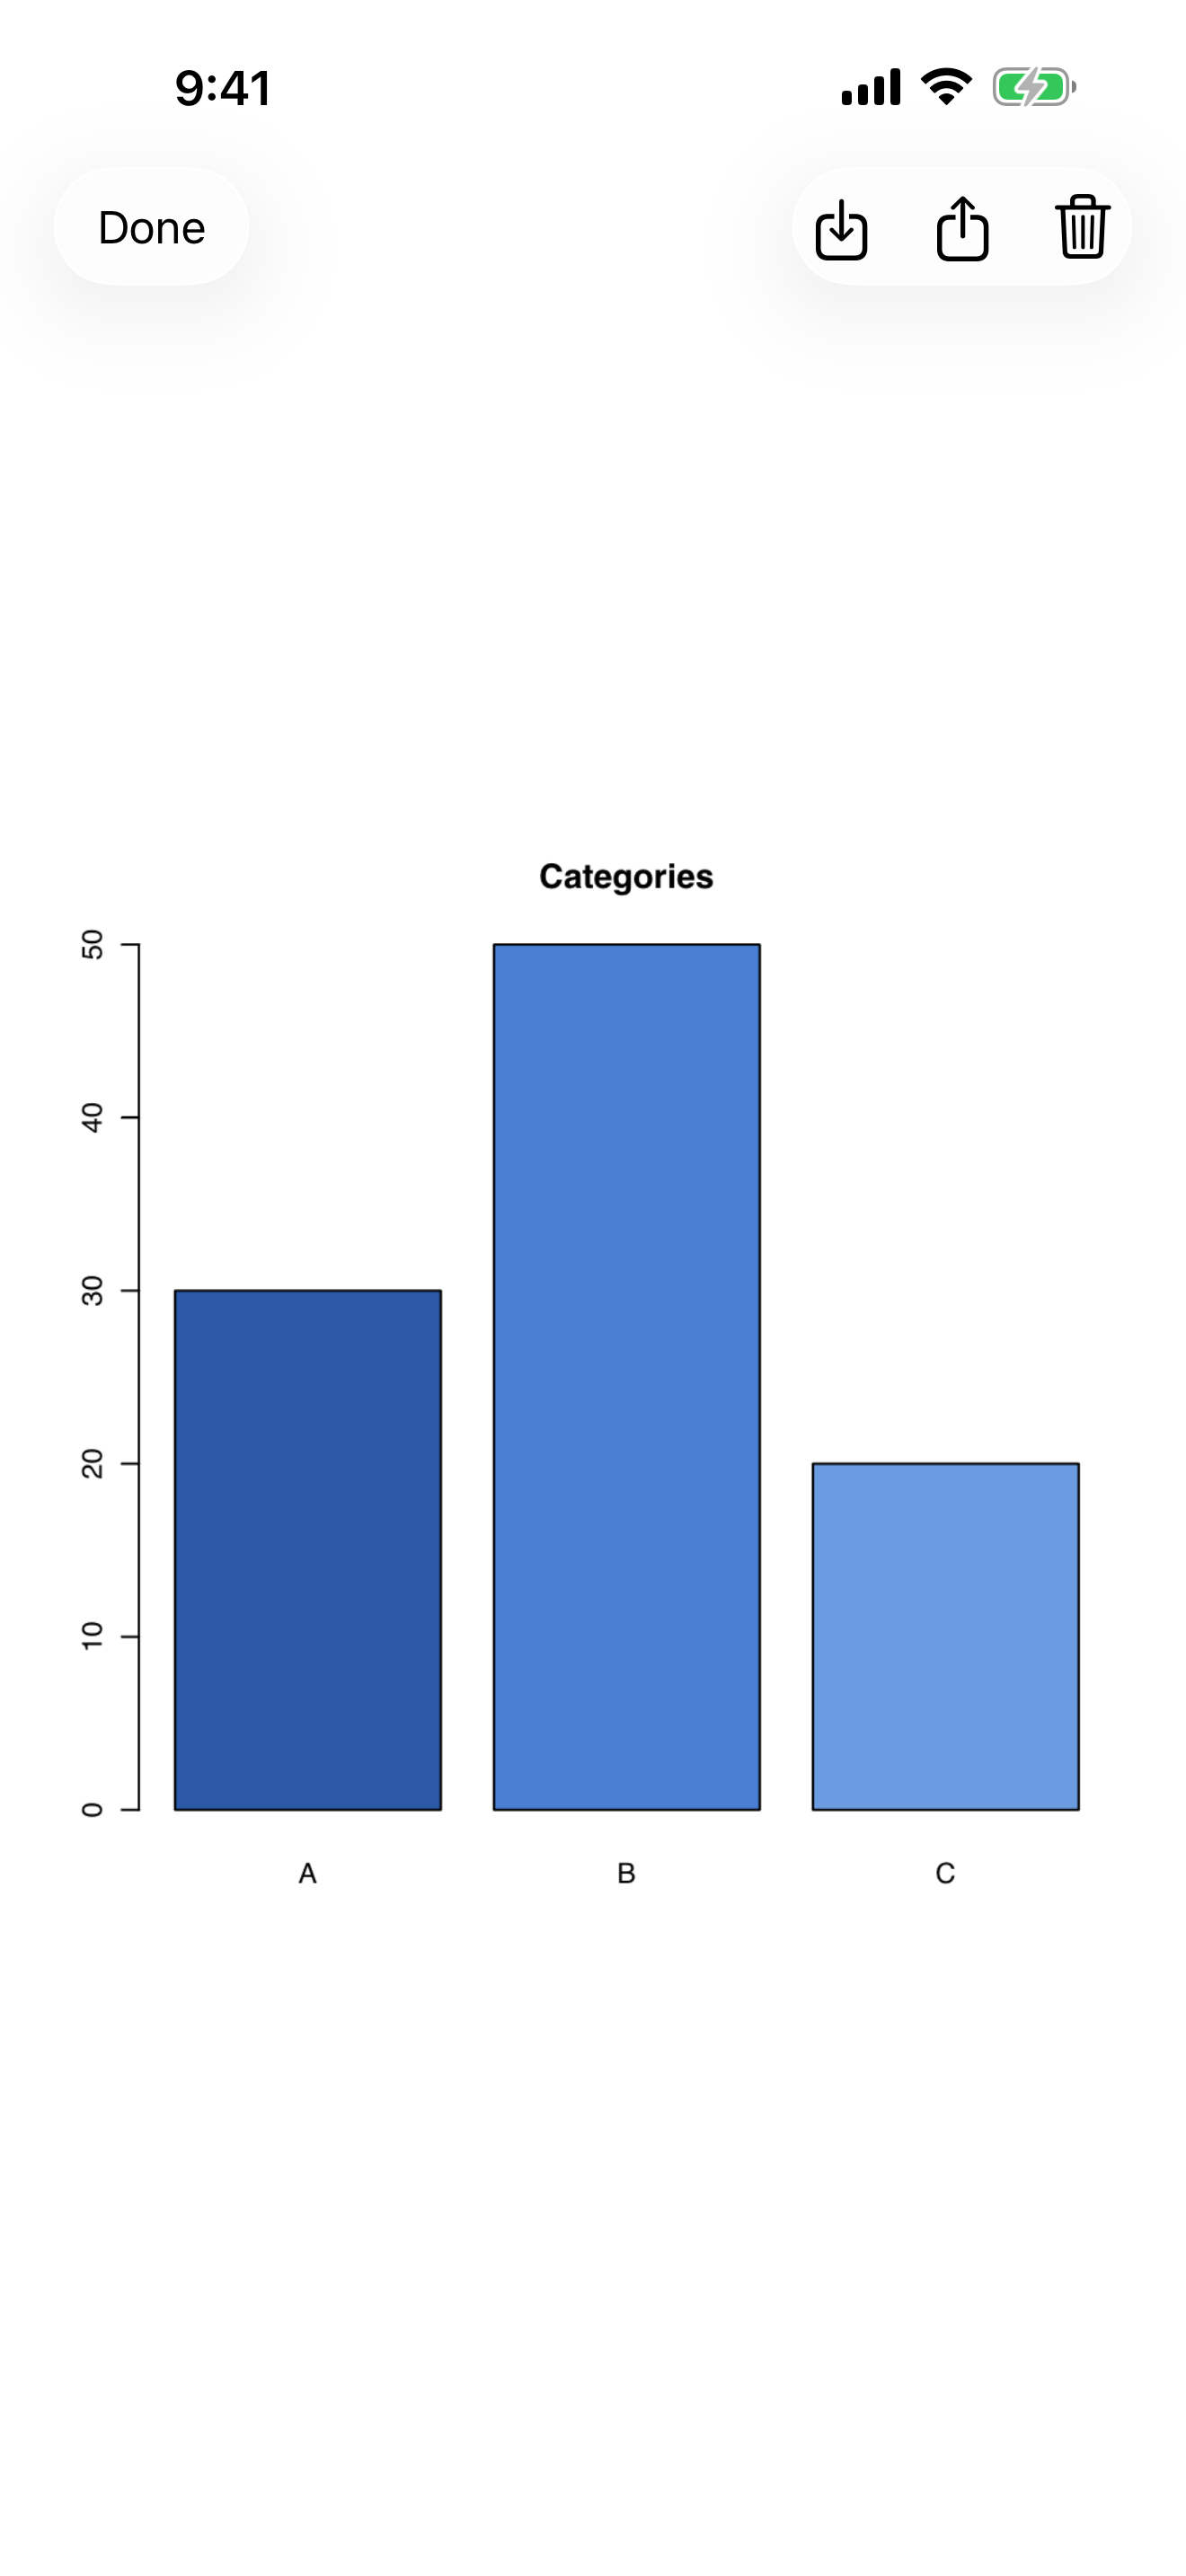
Viewing Plots in Detail
When you tap a plot thumbnail, it opens in a full-screen detail view where you can examine it closely. The detail view supports several gestures for navigating the image:
- Pinch to zoom: zoom in from 0.5x all the way up to 5x magnification to inspect fine details
- Drag to pan: when zoomed in, drag to move around the image
- Double-tap: toggles between 1x and 2x zoom, which is a quick way to zoom in on a section and then snap back to the full view
The toolbar at the top of the detail view gives you several options:
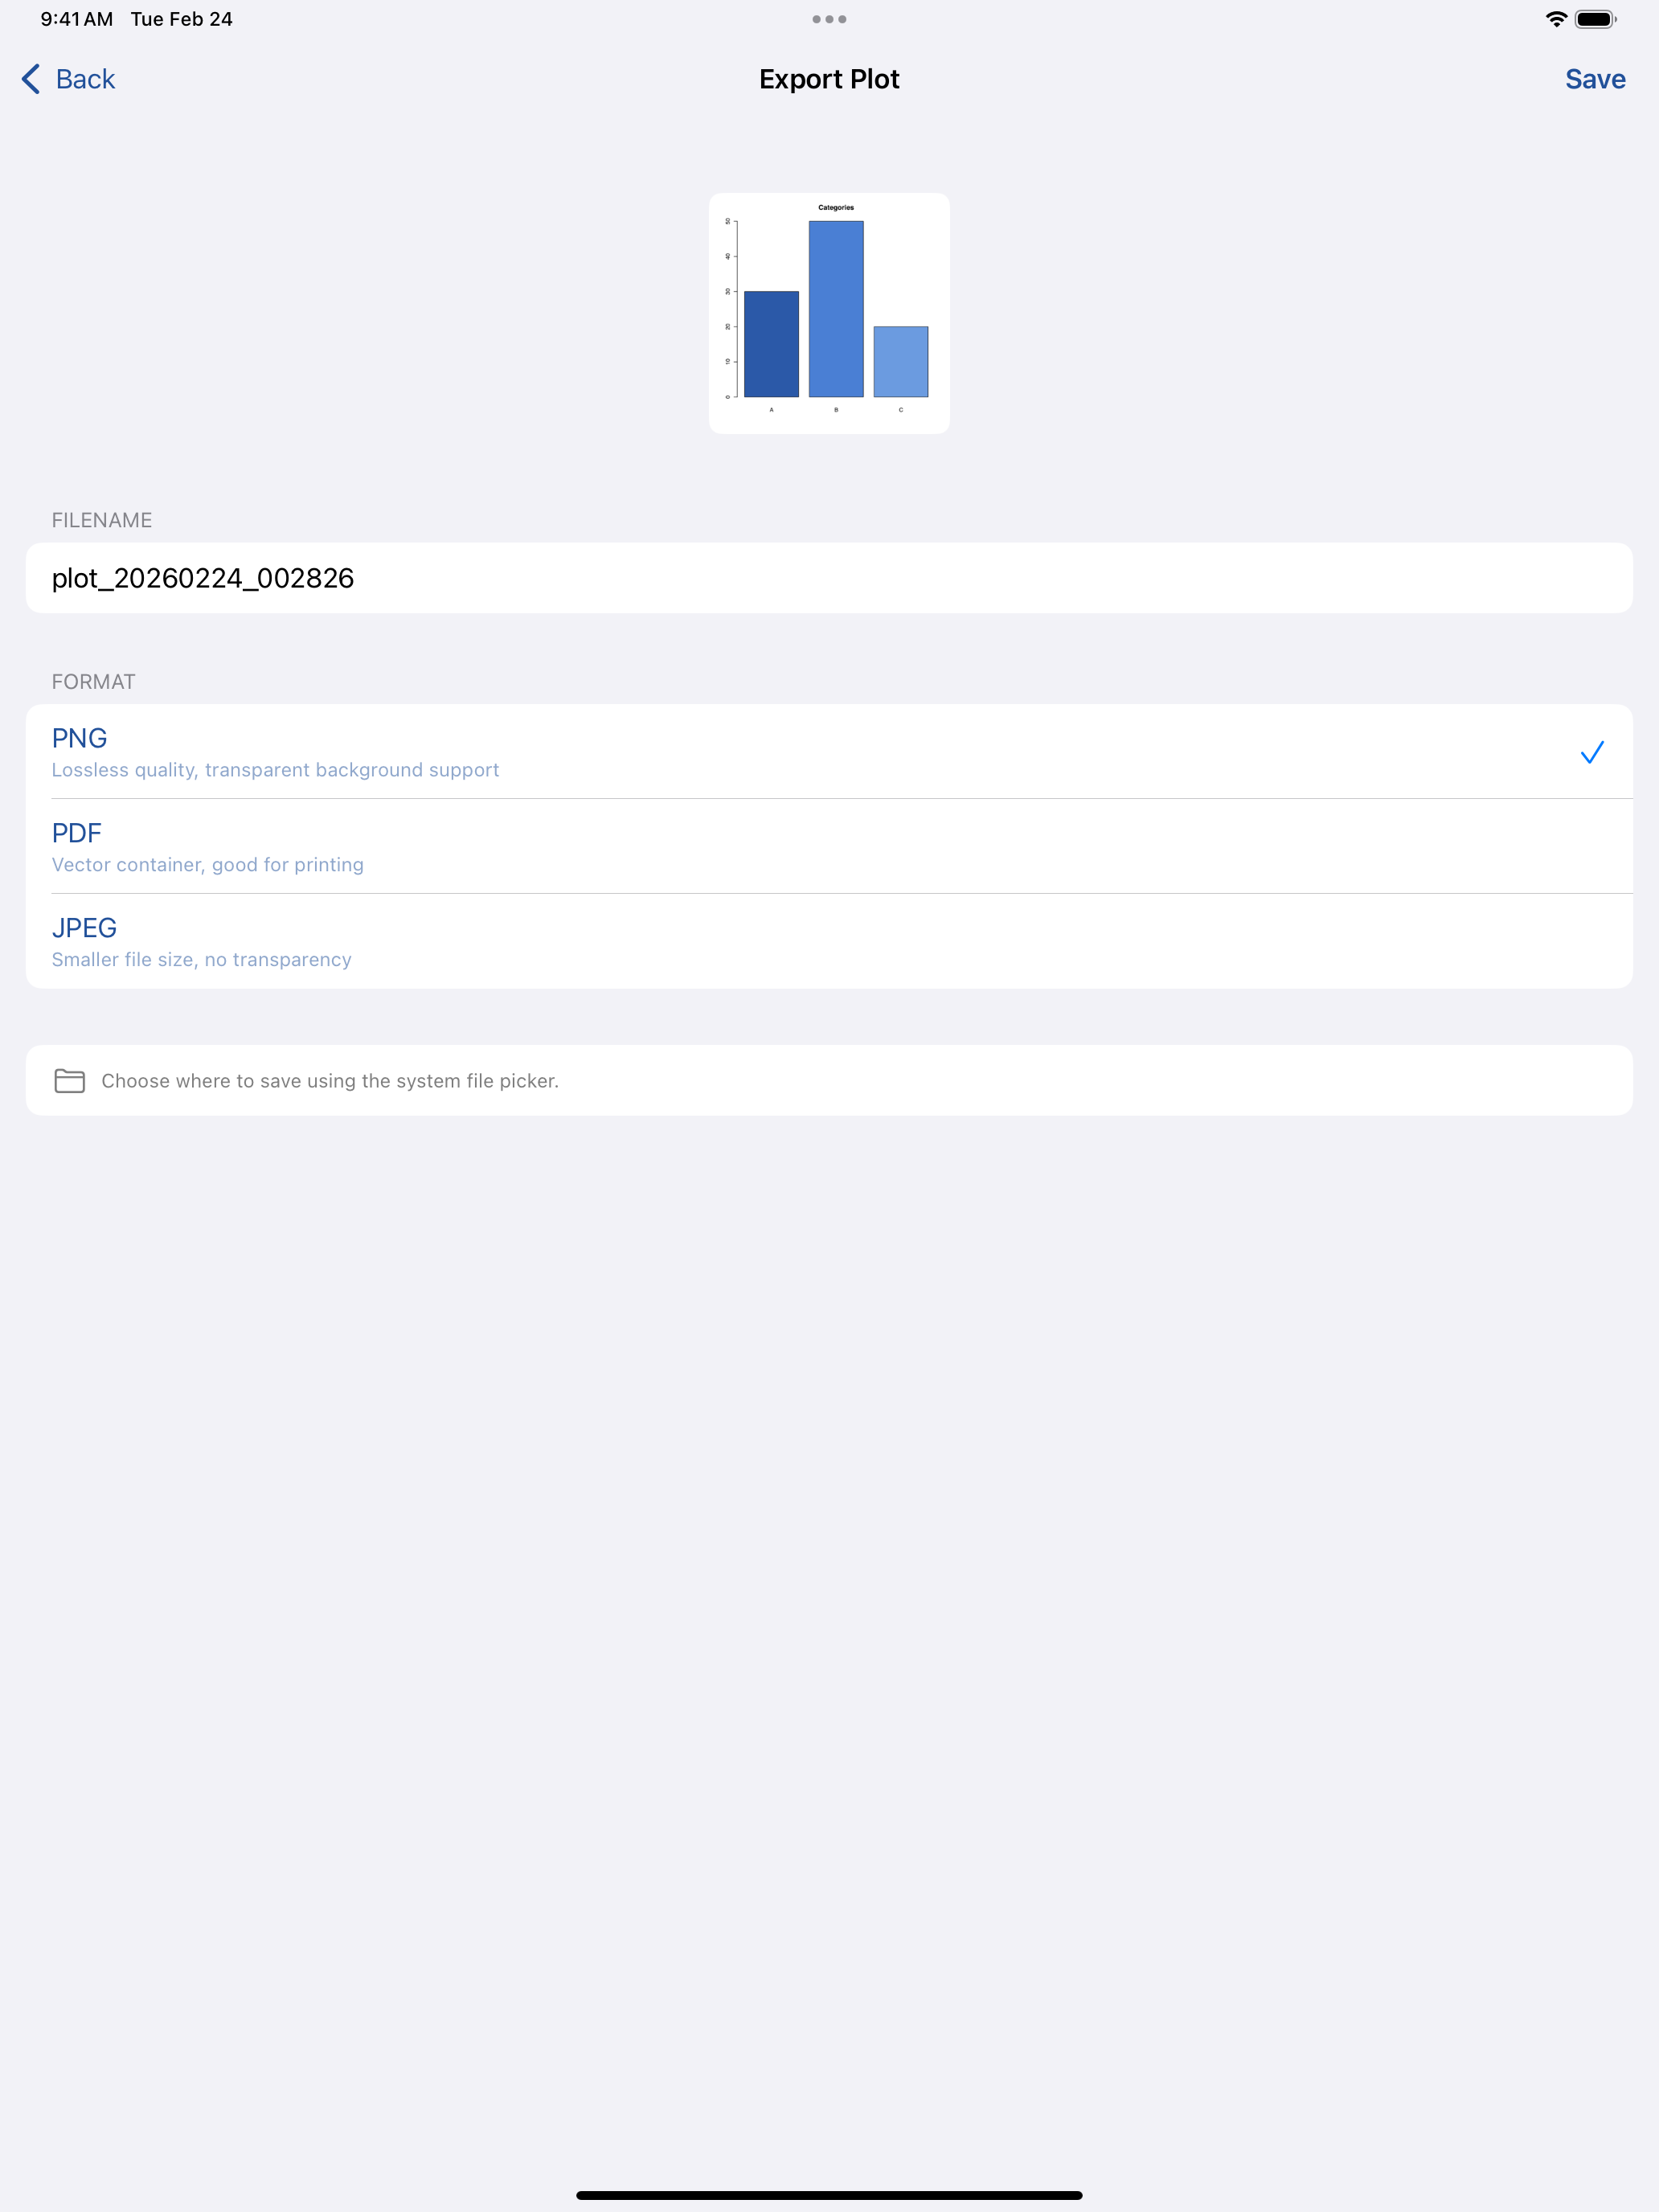
- Export: save the plot to a file in PNG, JPEG, or PDF format with a custom filename
- Share: use the iOS share sheet to send the plot to Photos, AirDrop, Mail, Messages, or any other app that accepts images
- Delete: remove this plot from the gallery
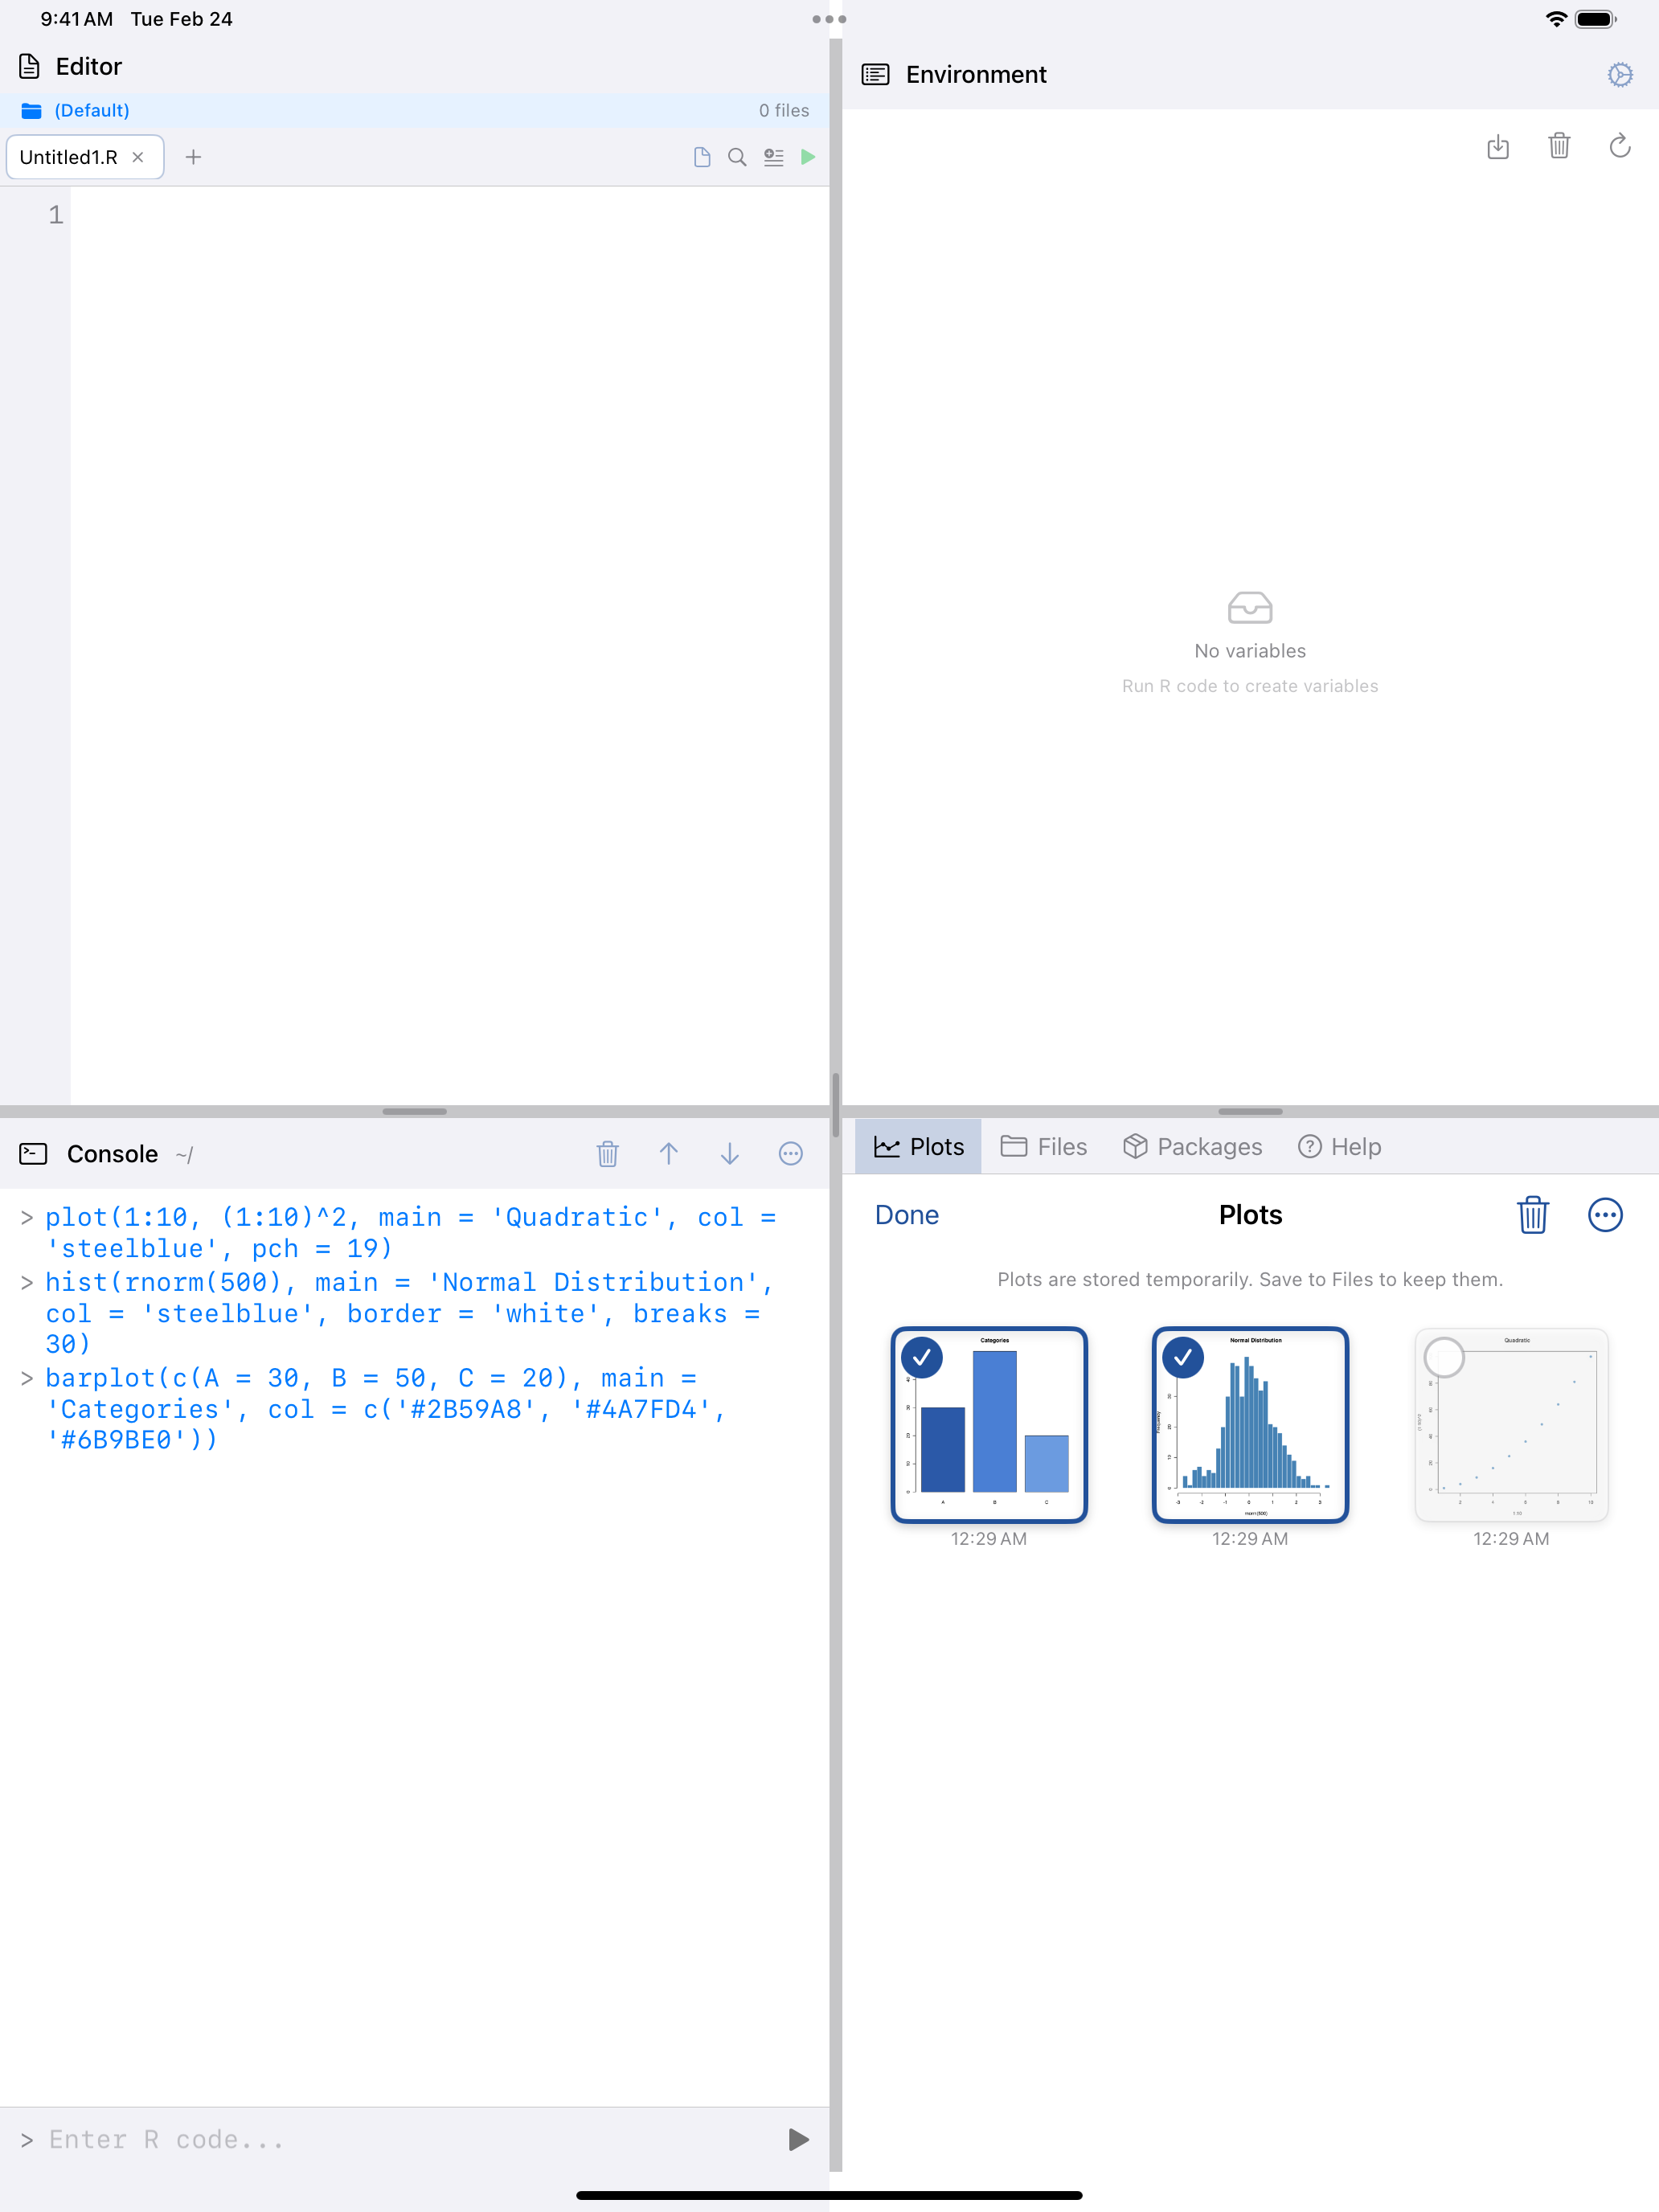
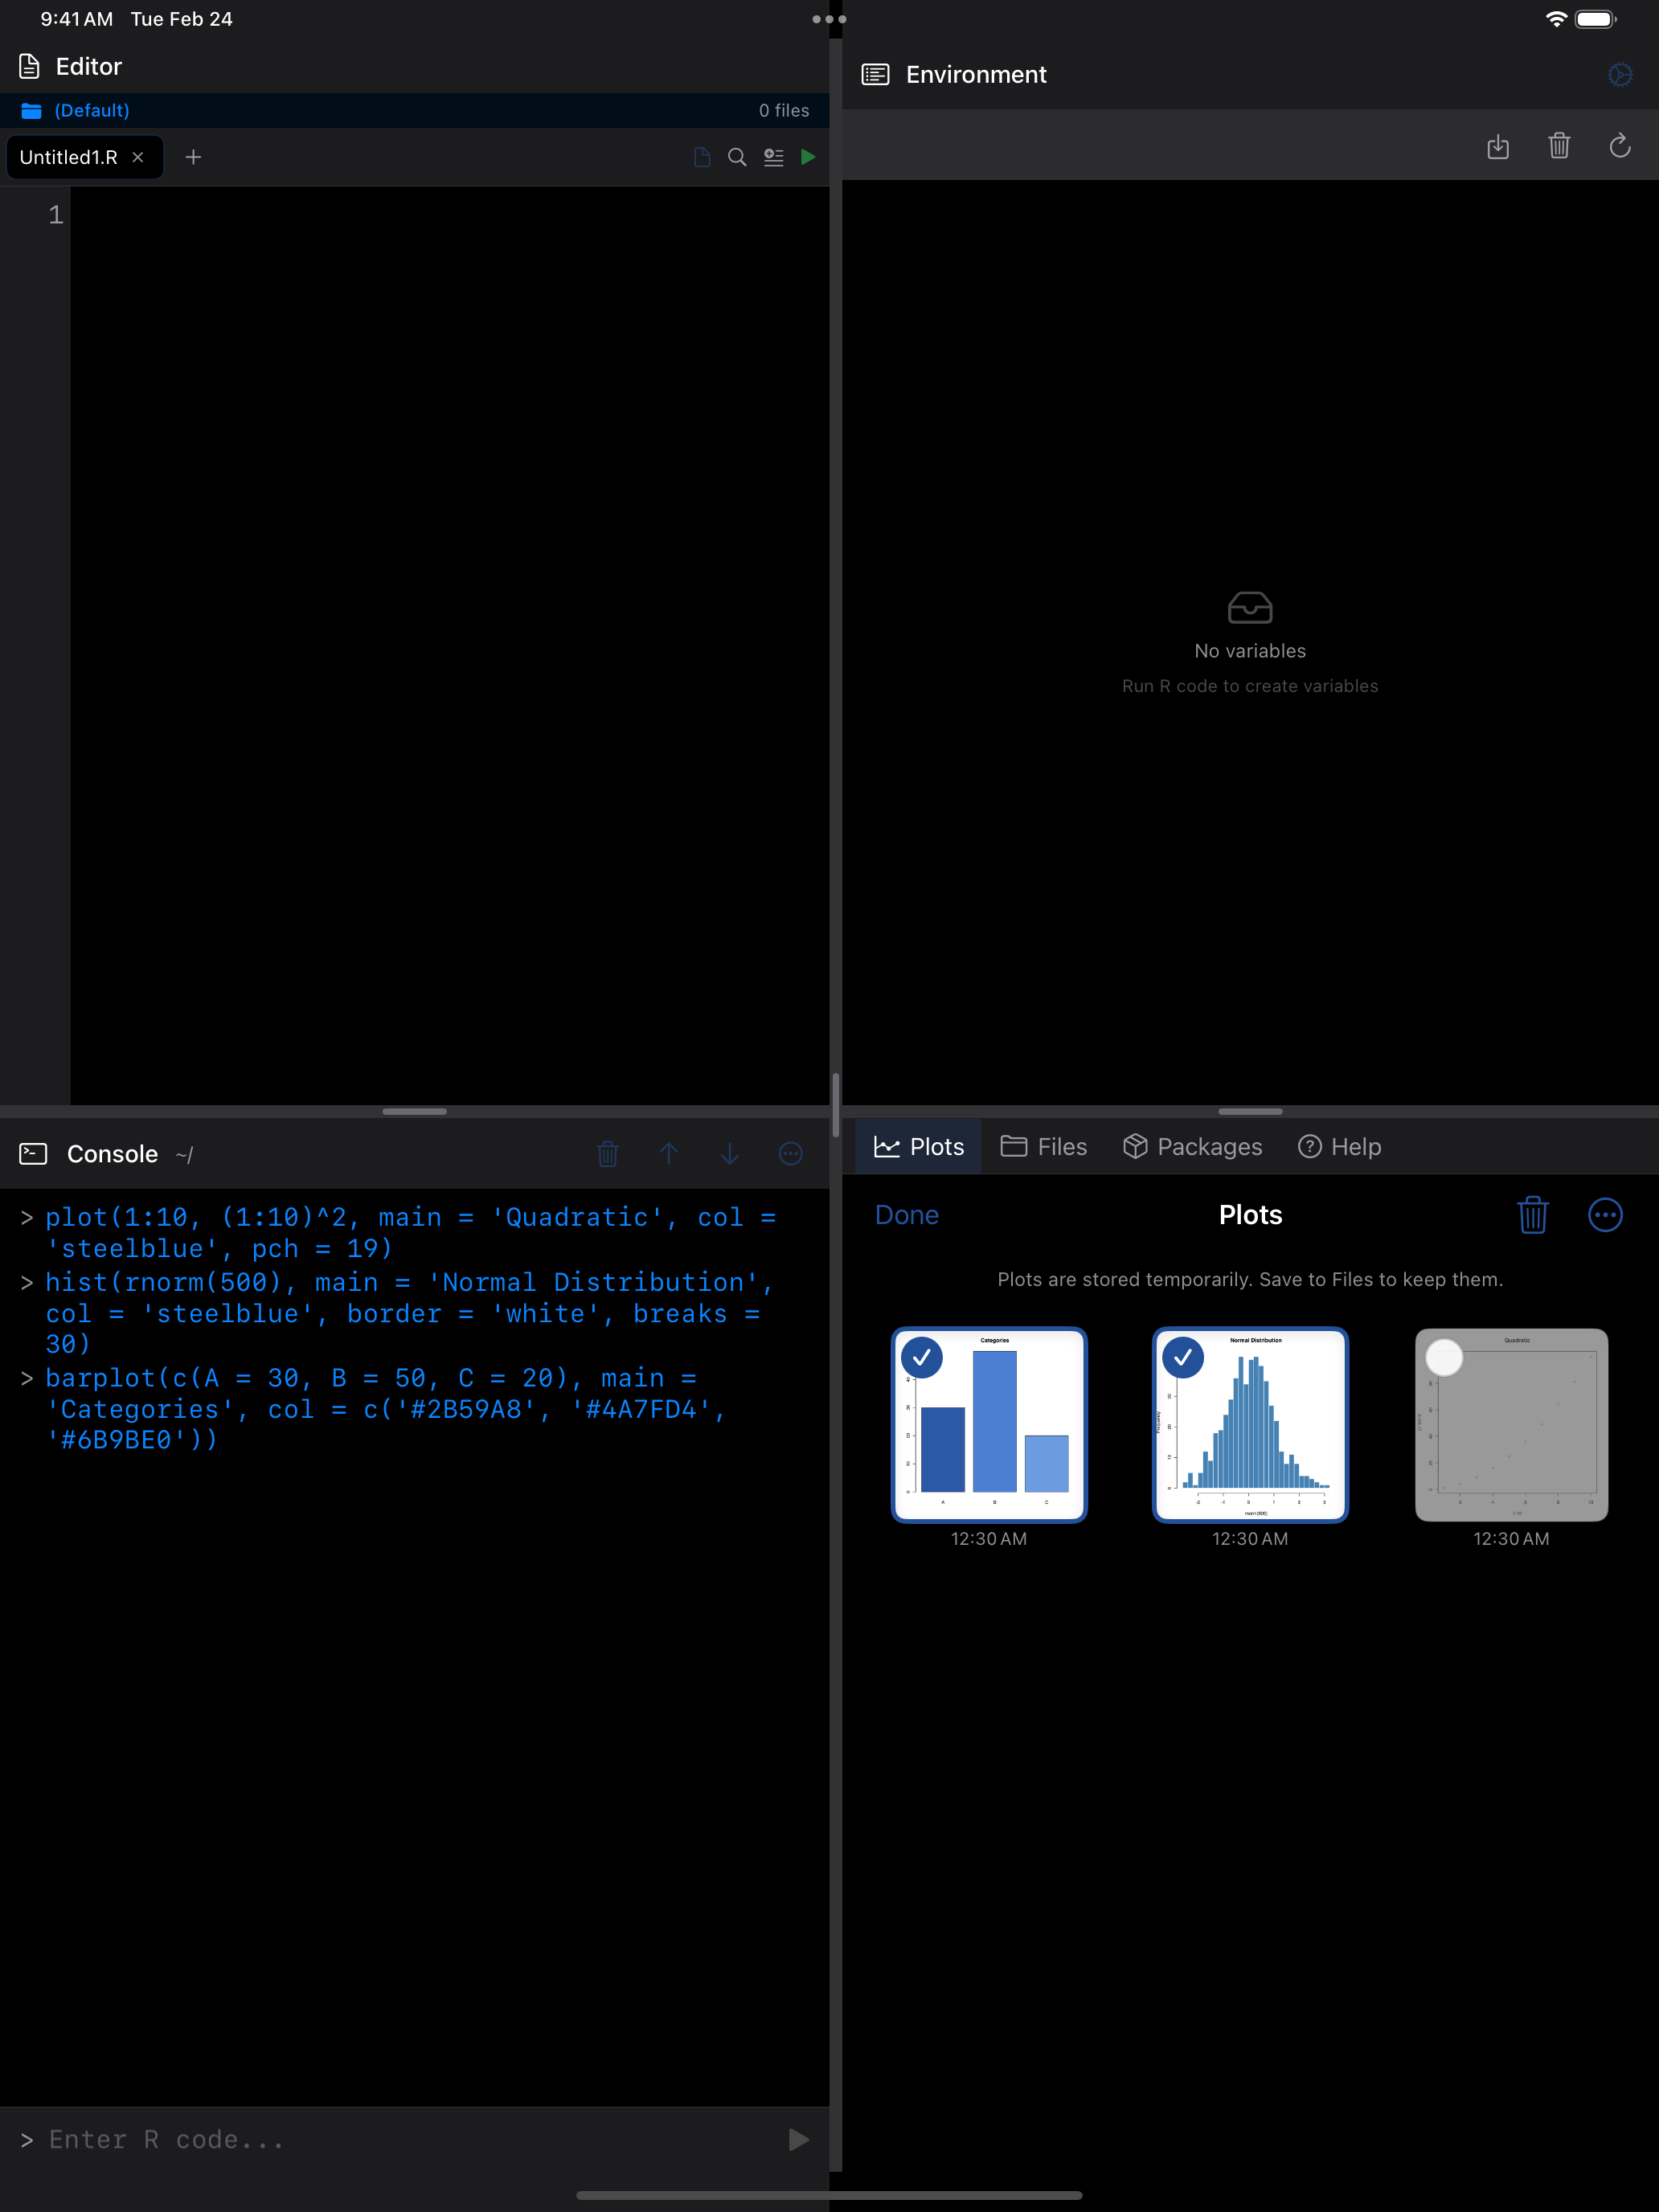
- Open in new window (iPad only): opens the plot in a separate window, so you can view it side by side with your code
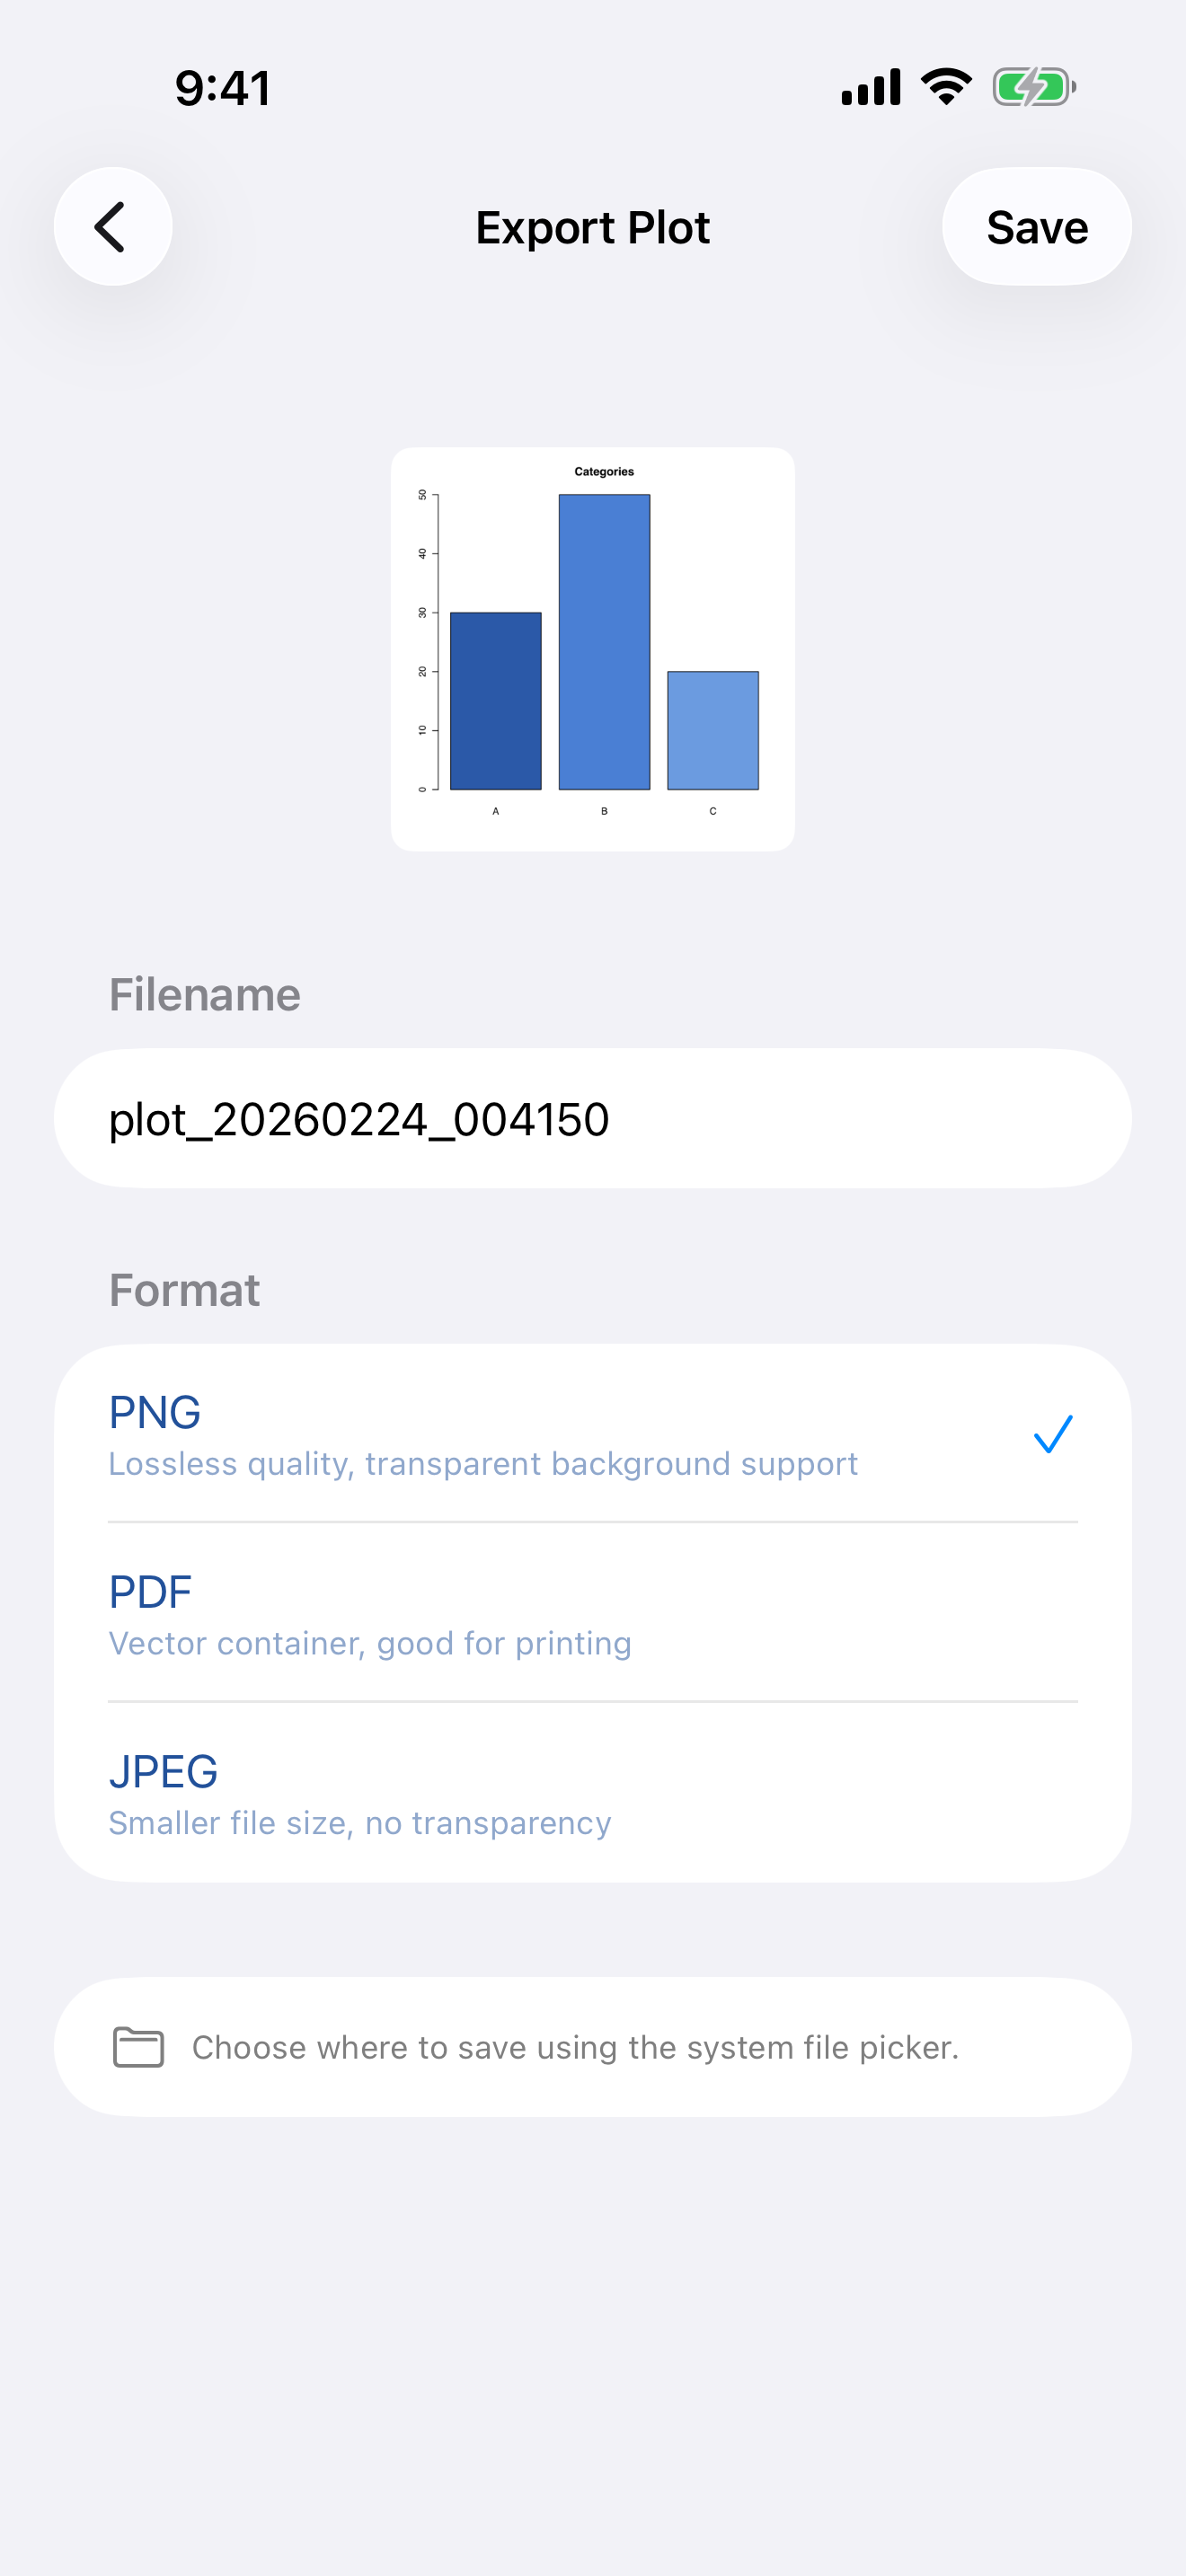
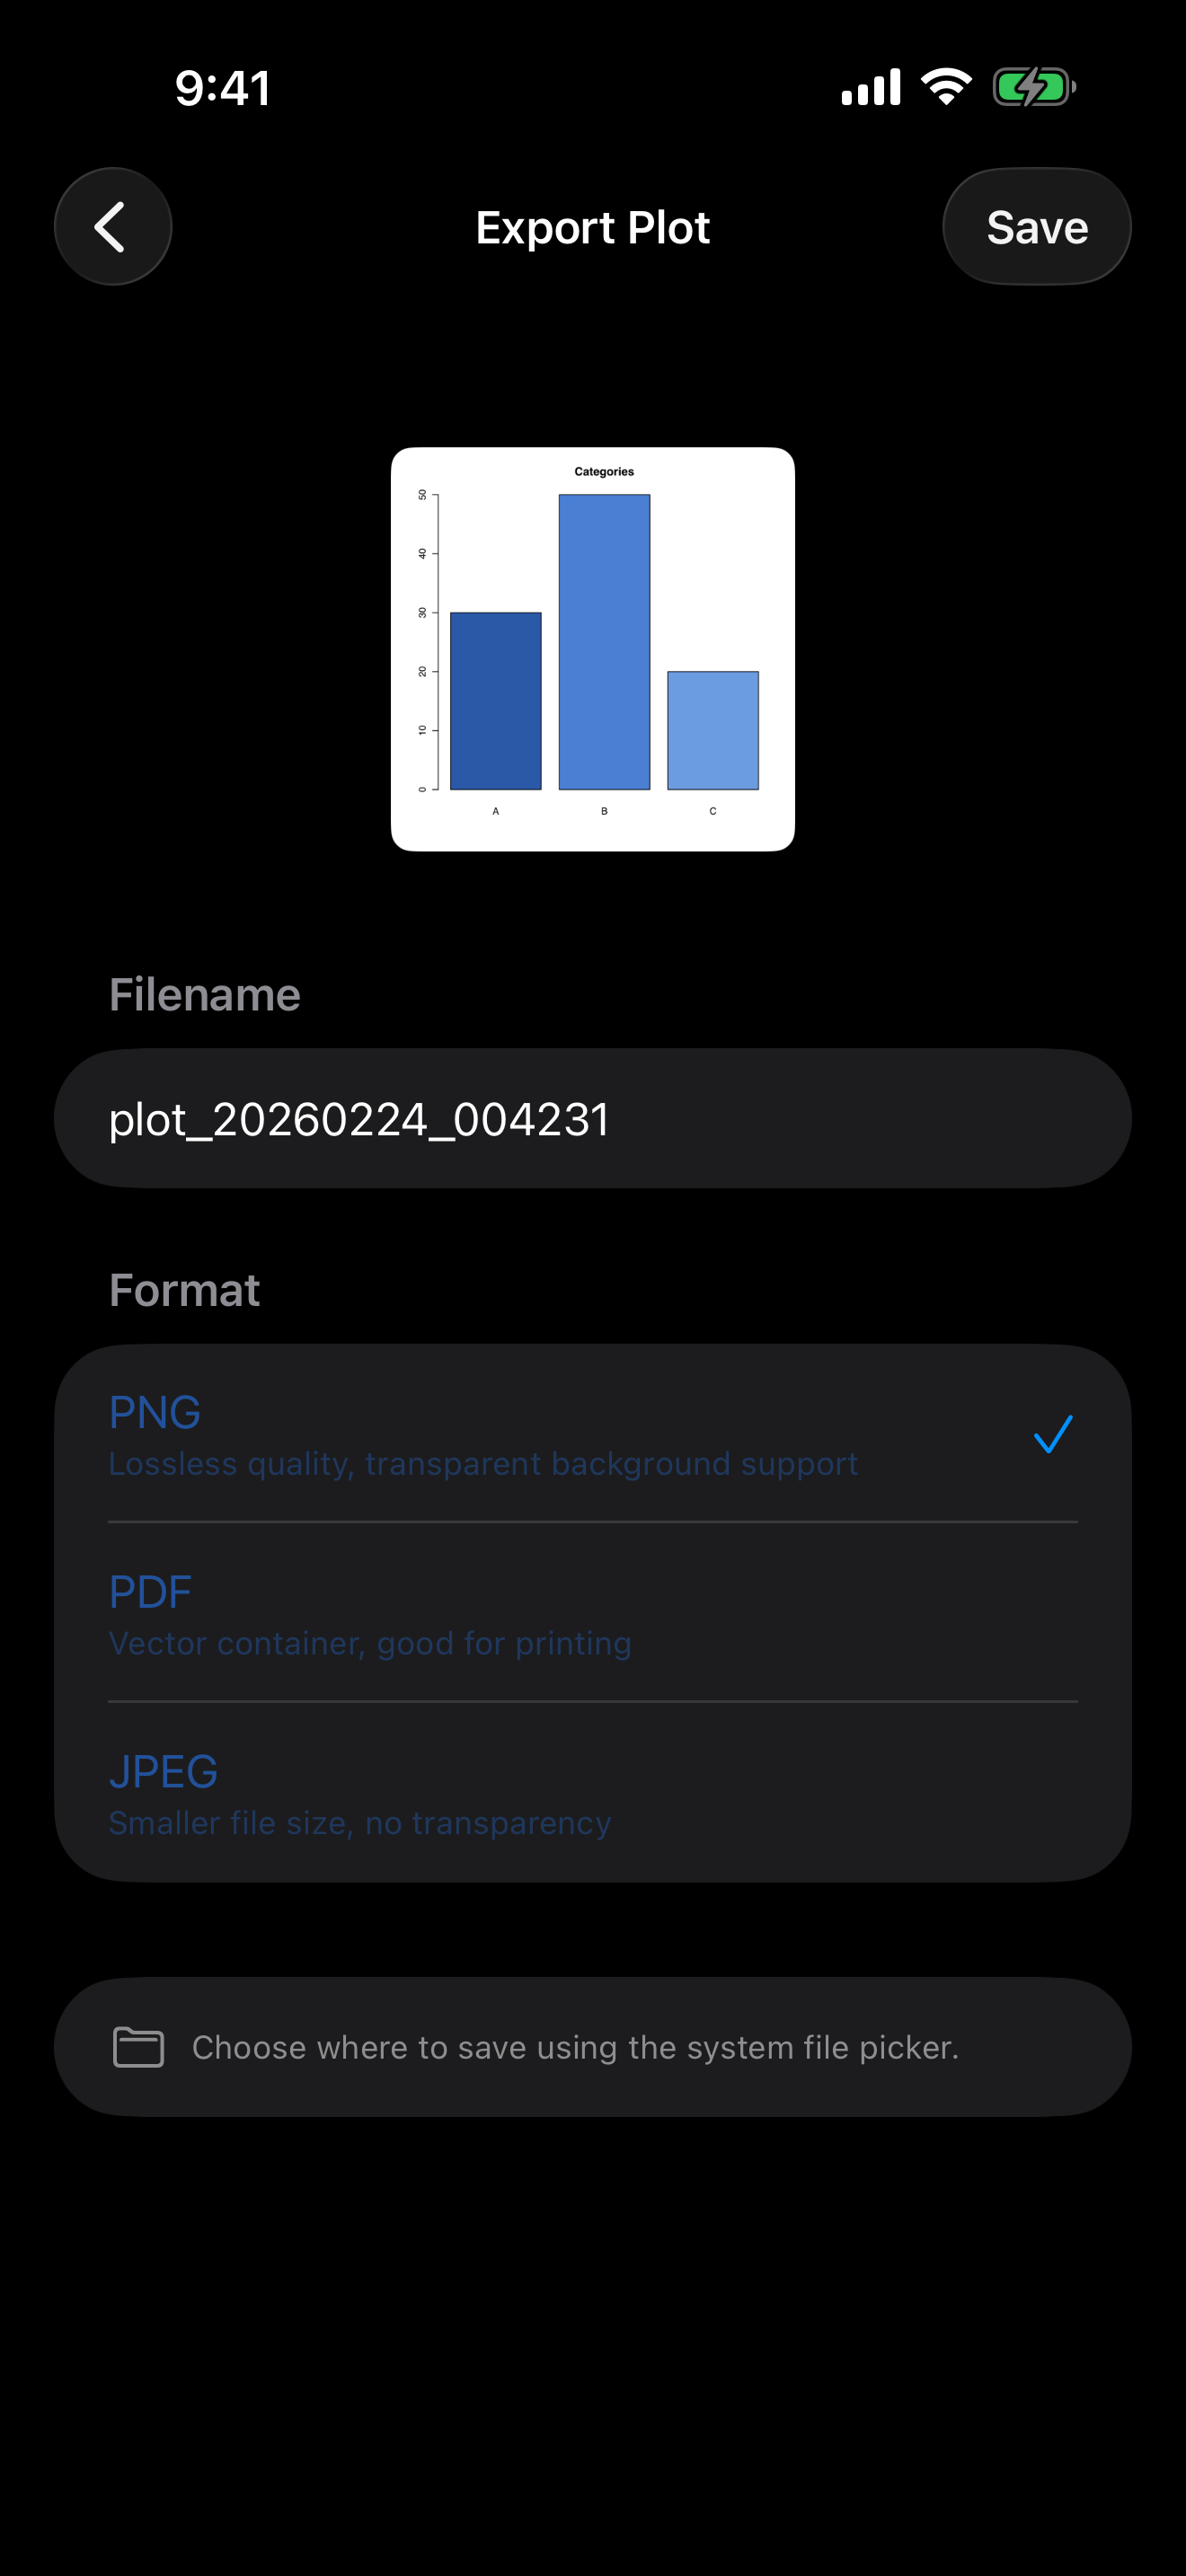
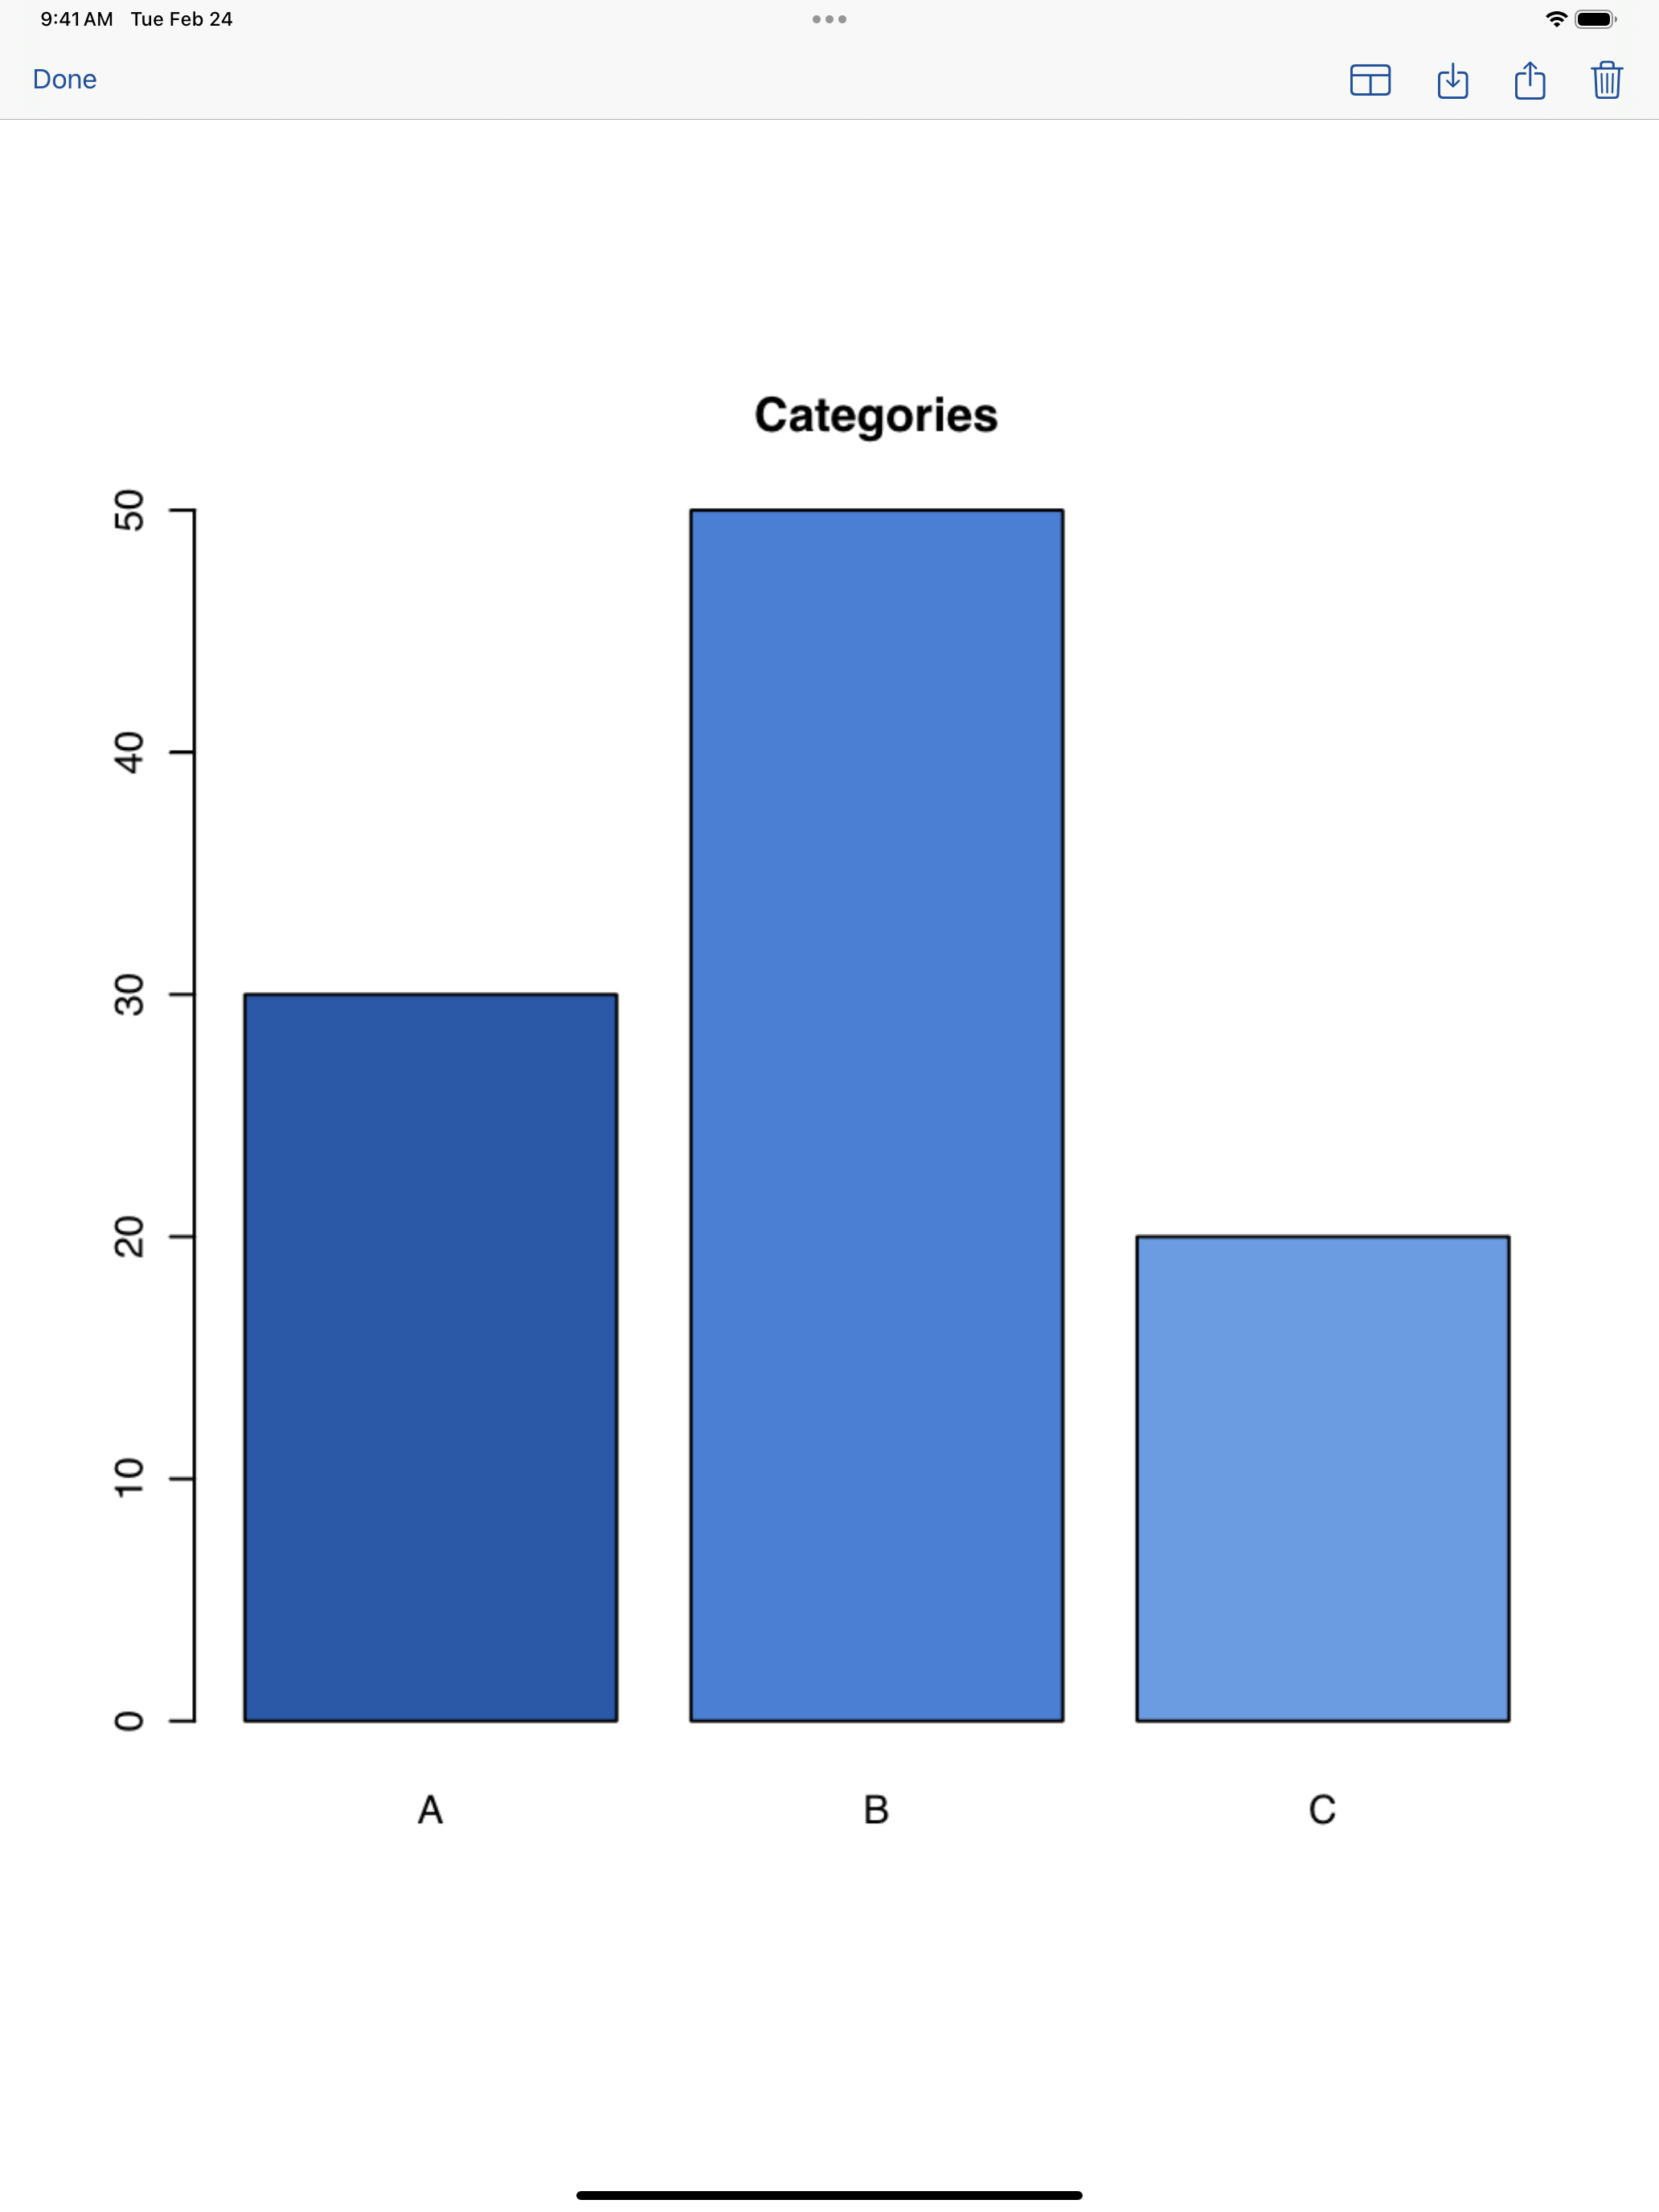
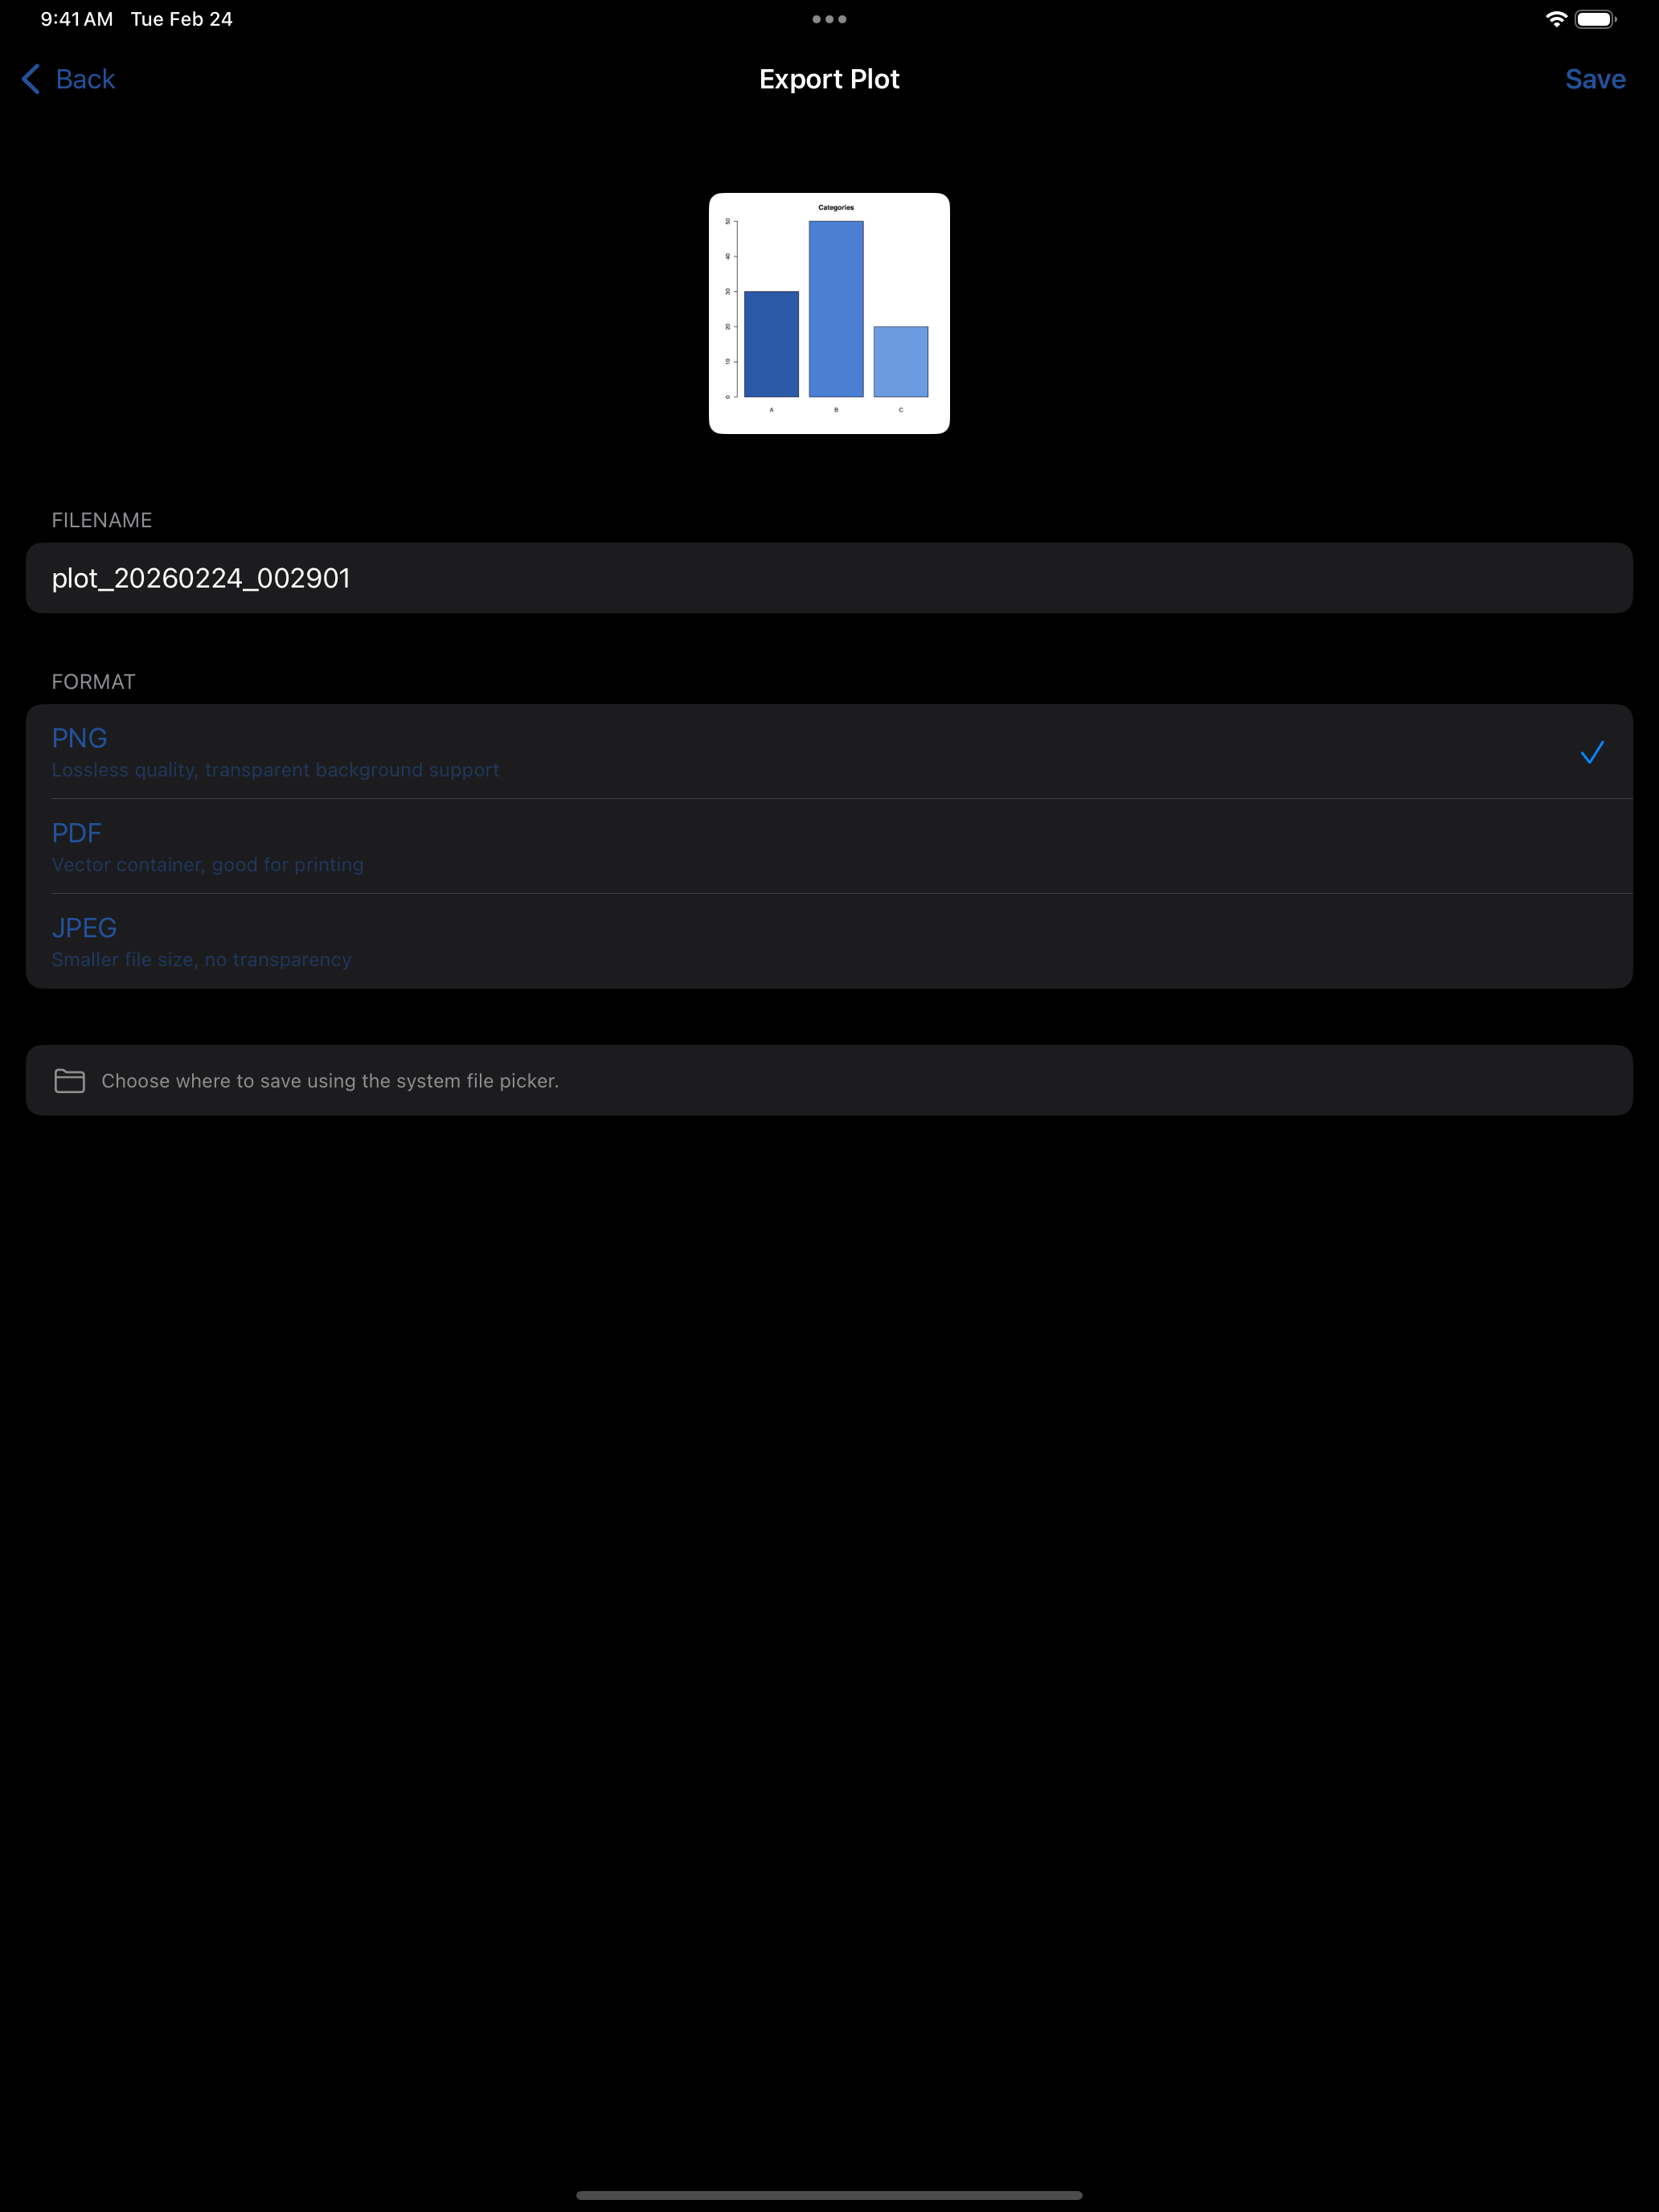
Left: Full-screen plot detail view with pinch-to-zoom support. Right: Export menu with format and filename options.
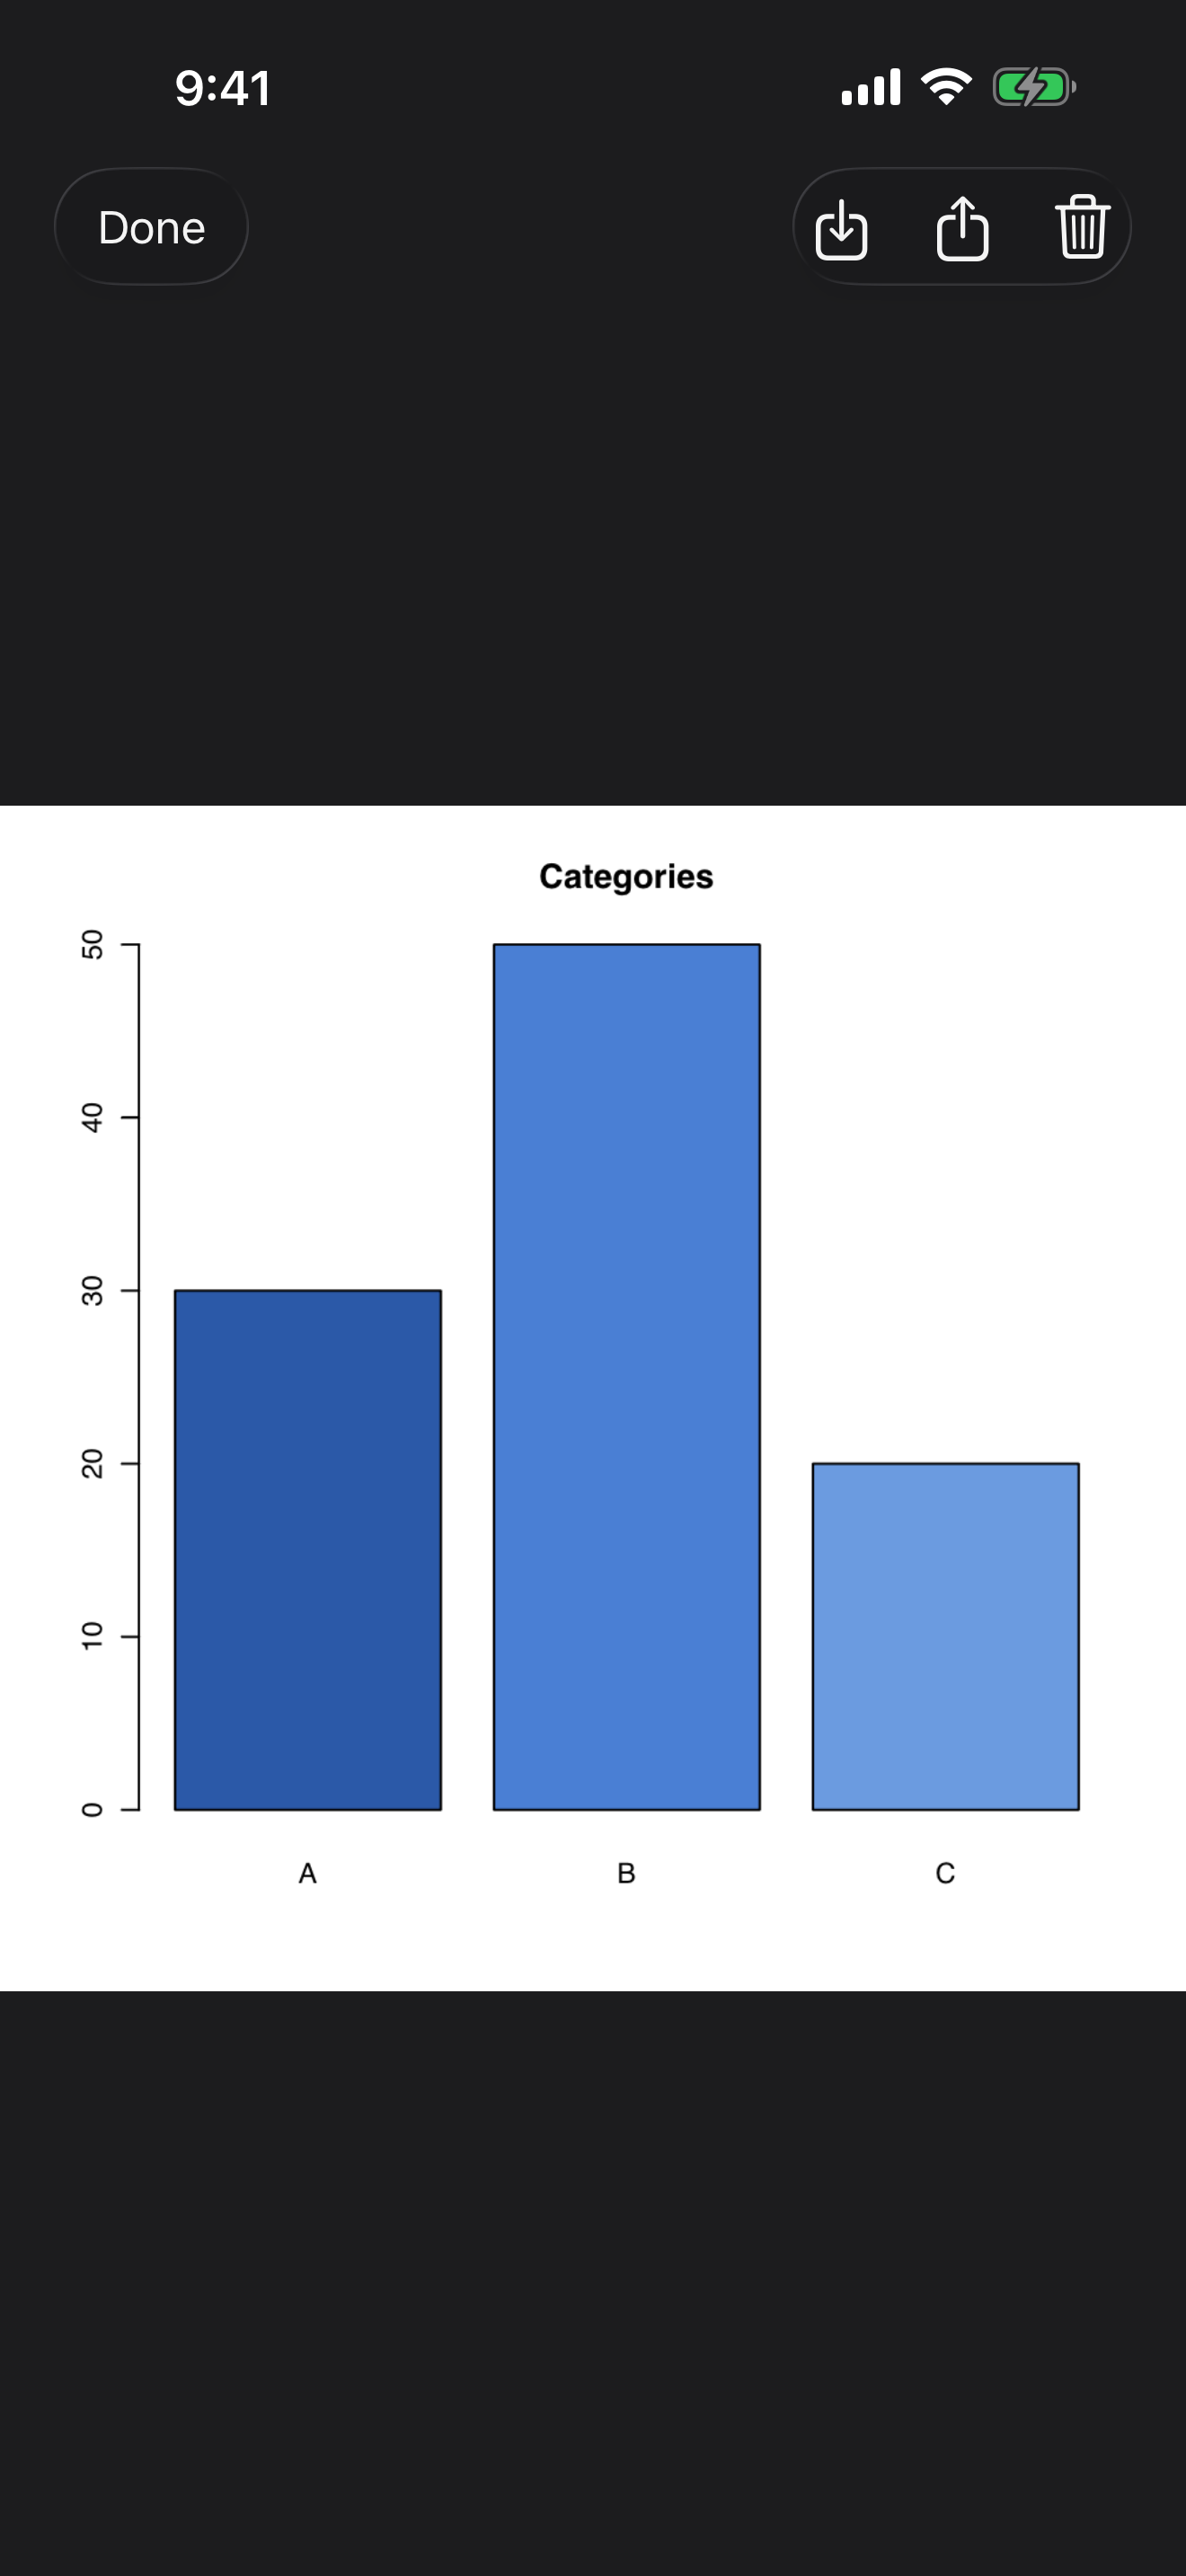
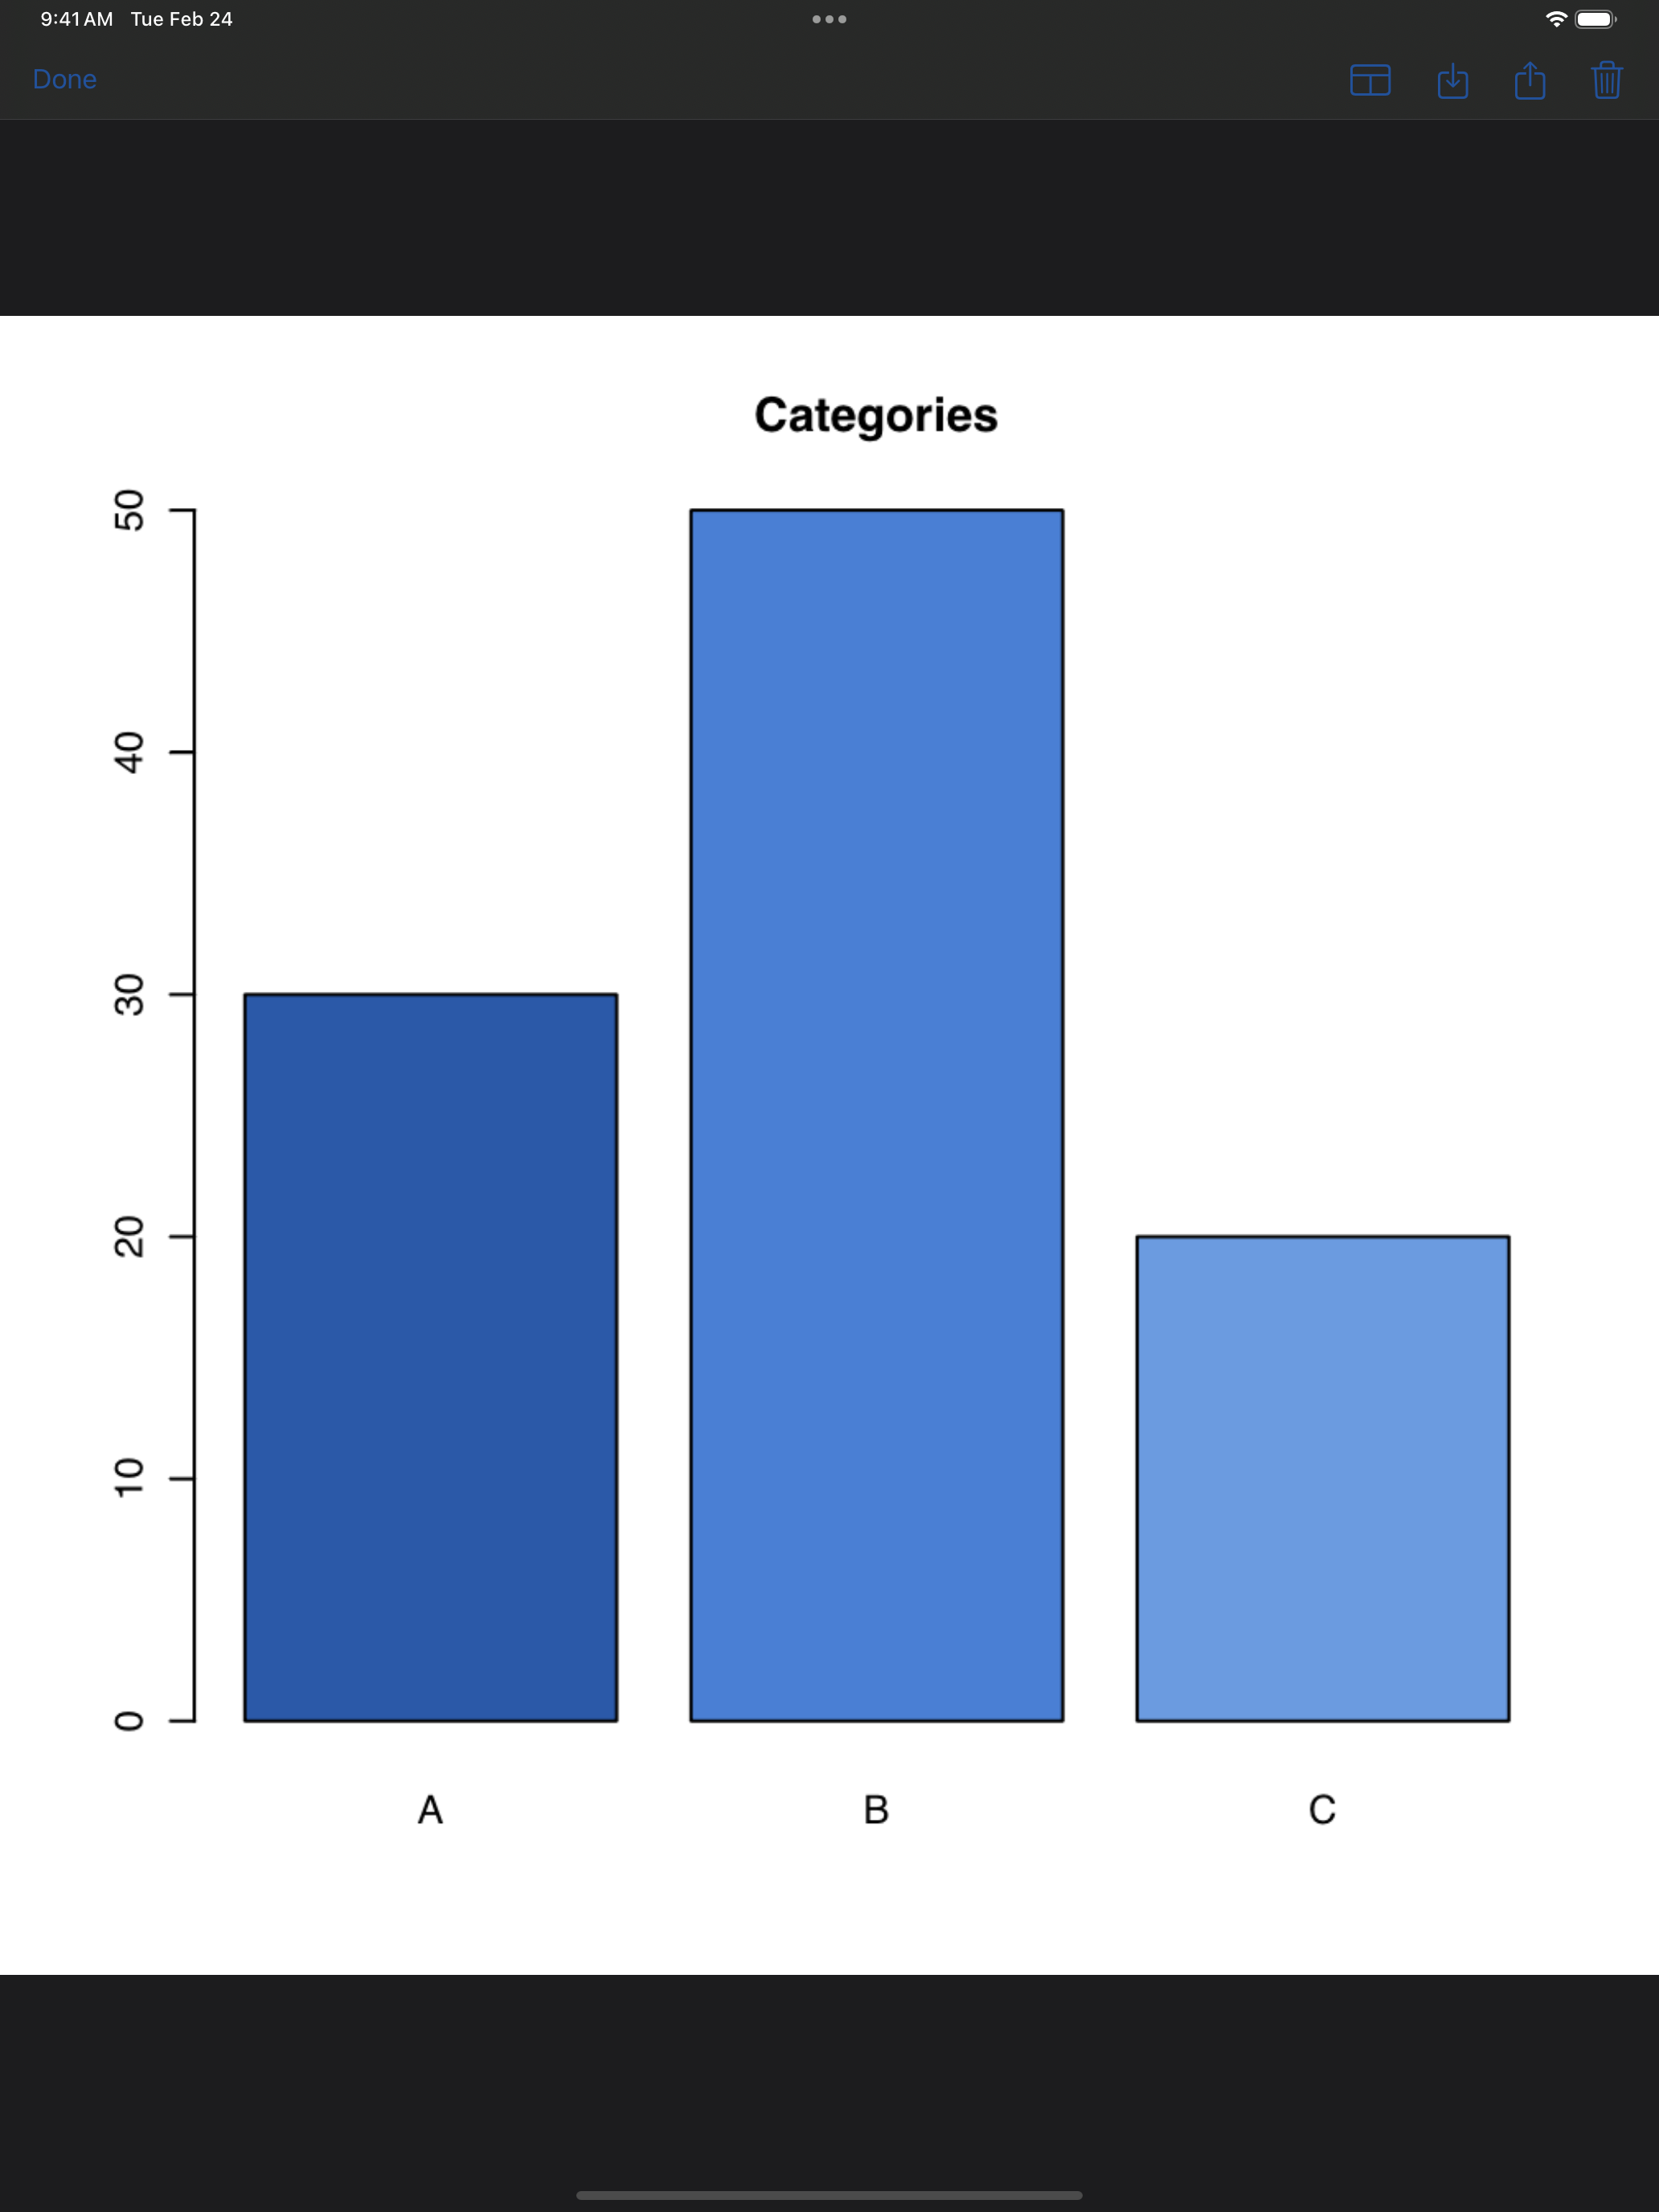
You can change the background color of the plot detail view in Settings. Options include matching your system theme, always white, always dark, or a neutral gray. This is especially useful if your plots have transparent backgrounds and you want to see them against a specific color.
Comparing Plots
When you have two or more plots, you can compare them side by side. This is especially useful when you are iterating on a visualization and want to see how your changes look next to the previous version.
To start a comparison:
- Tap Compare in the toolbar (it appears when you have at least two plots)
- Tap the two plots you want to compare. They get numbered badges showing which is “Plot 1” and “Plot 2”
- Tap View in the toolbar to open the comparison view
The comparison view shows both plots side by side (on landscape or iPad) or stacked (on portrait iPhone). You can pinch to zoom and pan both plots, and the sync zoom feature keeps them at the same zoom level and position by default so you can compare corresponding areas. Tap the link icon to turn sync off if you want to zoom each plot independently.
Selecting and Deleting Plots
To manage multiple plots at once, tap Select in the toolbar. Each thumbnail gets a selection circle. Tap the plots you want to act on, then use the Delete button to remove them in batch.
You can also delete a single plot by long-pressing its thumbnail and choosing Delete from the context menu, or by opening the detail view and tapping the trash icon.
To clear everything at once, tap the … menu and choose Clear All Plots.
Pinning Plots
If there is a plot you want to keep safe while clearing others, long-press the thumbnail and choose Pin. Pinned plots get an orange pin badge and are protected from deletion. You will need to unpin them first before you can delete them. This is handy when you have one “good” version of a chart and want to freely experiment without accidentally losing it.
Exporting Plots
There are two ways to get plots out of the app:
Quick share. From the detail view, tap the share button to use the standard iOS share sheet. This lets you save to Photos, copy to the clipboard, AirDrop to a Mac, or send through any app.
File export with format options. From the detail view, tap the export button (the download icon) to open the Export page. Here you can:
- Choose a filename
- Pick a format: PNG (lossless, supports transparency), JPEG (smaller files), or PDF (vector container, good for printing and papers)
- Save to any location via the iOS file picker, including iCloud Drive, external drives, or other cloud storage
Long-pressing a plot thumbnail in the gallery also gives you a quick Share option without needing to open the detail view first.
A Note on Storage
Plots are stored temporarily in the app’s memory and on-device cache. They persist across app launches, but iOS may reclaim the storage if the device is low on space. If you create a plot you want to keep permanently, use the export or share features to save it to Files, Photos, or another permanent location.